Matplotlib 教程 - 饼图
Jinku Hu
2024年2月15日

我们将在本教程中学习饼图。
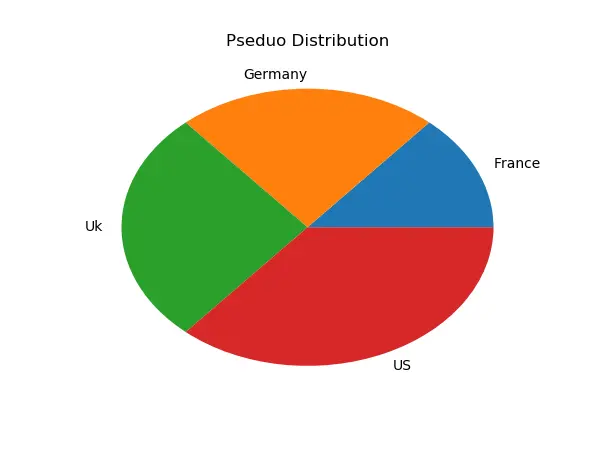
# -*- coding: utf-8 -*-
import matplotlib.pyplot as plt

x = np.array([15, 25, 30, 40])
label = ["France", "Germany", "Uk", "US"]

plt.pie(x, labels=label)
plt.show()
语法
matplotlib.pyplot.pie(
    x,
    explode=None,
    labels=None,
    colors=None,
    autopct=None,
    pctdistance=0.6,
    shadow=False,
    labeldistance=1.1,
    startangle=None,
    radius=None,
    counterclock=True,
    wedgeprops=None,
    textprops=None,
    center=(0, 0),
    frame=False,
    hold=None,
    data=None,
)
参数
| 名称 | 描述 |
|---|---|
label |
标签文字 |
fontdict |
标签文字字体字典,例如字体系列、颜色、粗细和大小 |
labelpad |
标签和 x 轴之间的间距,以 points 为单位 |
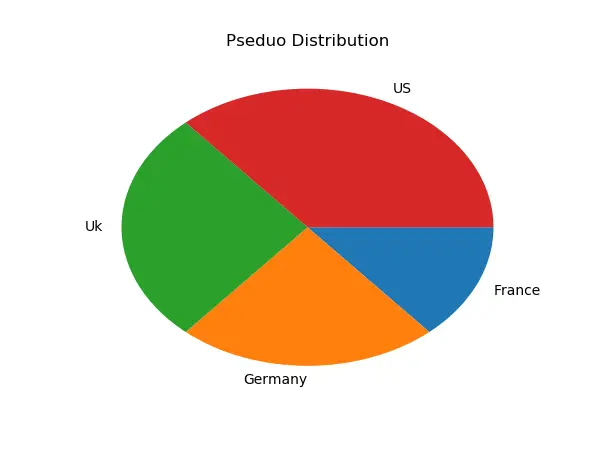
顺时针方向绘制的饼图
如果参数 counterclock 设置为 False,则饼形图将按顺时针方向绘制。
# -*- coding: utf-8 -*-
import matplotlib.pyplot as plt

x = np.array([15, 25, 30, 40])
label = ["France", "Germany", "Uk", "US"]

plt.pie(x, labels=label, counterclock=False)
plt.show()
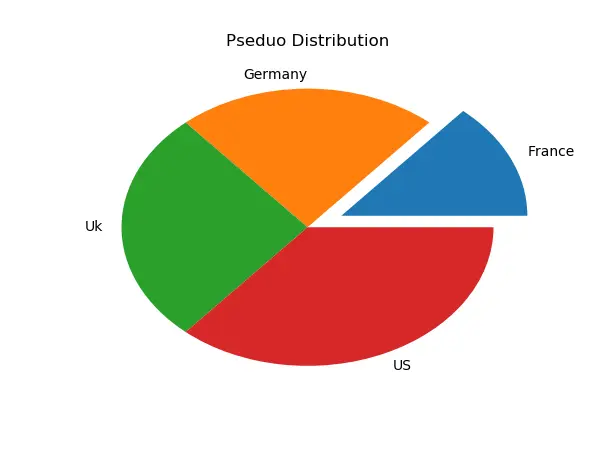
饼图与爆炸切片
explode 参数控制饼图中的切片爆炸。它指定偏移每个楔形的半径的分数。
# -*- coding: utf-8 -*-
import matplotlib.pyplot as plt

x = np.array([15, 25, 30, 40])
label = ["France", "Germany", "Uk", "US"]

plt.pie(x, labels=label, explode=(0.2, 0, 0, 0))
plt.show()
作者: Jinku Hu

Founder of DelftStack.com. Jinku has worked in the robotics and automotive industries for over 8 years. He sharpened his coding skills when he needed to do the automatic testing, data collection from remote servers and report creation from the endurance test. He is from an electrical/electronics engineering background but has expanded his interest to embedded electronics, embedded programming and front-/back-end programming.
LinkedIn