Matplotlib 教程 - 坐标轴标签
在本教程中,我们将学习 Matplotlib 中的坐标轴标签、标题和图例。这些可以提高绘图的自解释性。
Matplotlib 坐标轴标签
matplotlib.pyplot.xlabel(label, fontdict=None, labelpad=None, **kwargs)
它用来设置 x 轴的标签。同样的,matplotlib.pyplot.ylabel 用来设置 y 轴的标签。
参数
| 名称 | 描述 |
|---|---|
label |
标签文字 |
fontdict |
标签文字字体字典,例如字体系列、颜色、粗细和大小 |
labelpad |
标签和 x 轴之间的间距 |
# -*- coding: utf-8 -*-
import numpy as np
import matplotlib.pyplot as plt

x = np.linspace(0, 4 * np.pi, 1000)
y = np.sin(x)

plt.figure(figsize=(4, 3))

plt.plot(x, y, "r")
plt.xlabel("Time (s)", family="serif", color="r", weight="normal", size=16, labelpad=6)

plt.show()
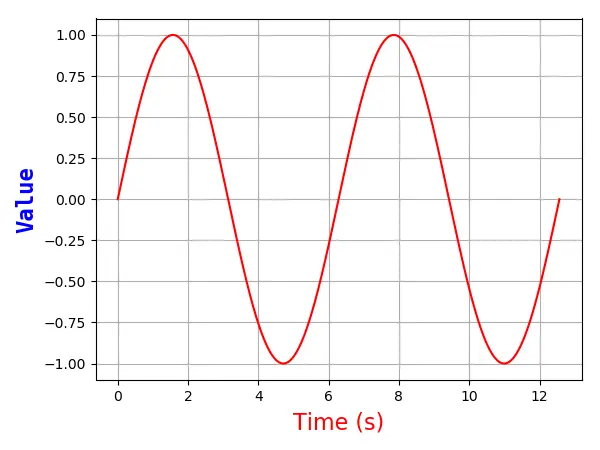
它指定 x 轴的标签如下,
plt.xlabel("Time (s)", family="serif", color="r", weight="normal", size=16, labelpad=6)
以下是详细说明,
-
Times (s)这是 x 轴的标签文字
-
family='serif'它指定标签文本字体系列为
serif。你可以从热门选项中选择字体,例如[ 'serif' | 'sans-serif' | 'cursive' | 'fantasy' | 'monospace' ]。 -
color='r'字体文本为红色。请参考上一章的颜色选项以选择更多颜色。
-
weight='normal'它指定标签文本具有正常的粗细。选项是
['light', 'normal', 'medium', 'semibold', 'bold', 'heavy', 'black']。 -
size=16它将字体大小设置为 16。
-
labelpad = 6x 轴与标签之间的距离为
6px。

Founder of DelftStack.com. Jinku has worked in the robotics and automotive industries for over 8 years. He sharpened his coding skills when he needed to do the automatic testing, data collection from remote servers and report creation from the endurance test. He is from an electrical/electronics engineering background but has expanded his interest to embedded electronics, embedded programming and front-/back-end programming.
LinkedIn