设置 Seaborn 热图的大小
-
使用
seaborn.set()函数设置 seaborn 热图大小 -
使用
matplotlib.pyplot.figure()函数设置 seaborn 热图大小 -
使用
matplotlib.pyplot.gcf()函数设置 seaborn 图的大小

热图用于生成矩阵的图形表示。它在图形上绘制一个矩阵,并为不同的值使用不同的颜色深浅。
我们可以使用 seaborn.heatmap() 函数在 seaborn 模块中创建热图。
在表示大型矩阵时,图的默认大小可能无法清楚地表示数据。
在本教程中,我们将解决这个问题并学习如何改变 seaborn 热图的大小。
由于 heatmap() 返回一个 matplotlib-axes 对象,我们也可以使用该库中的函数。
使用 seaborn.set() 函数设置 seaborn 热图大小
set() 函数定义了 seaborn 绘图的配置和主题。我们可以在 rc 参数中提及绘图的大小。
例如,
import pandas as pd
import matplotlib.pyplot as plt
import seaborn as sns

df = pd.DataFrame(
    {
        "Day 1": [7, 1, 5, 6, 3, 10, 5, 8],
        "Day 2": [1, 2, 8, 4, 3, 9, 5, 2],
        "Day 3": [4, 6, 5, 8, 6, 1, 2, 3],
        "Day 4": [5, 8, 9, 5, 1, 7, 8, 9],
    }
)

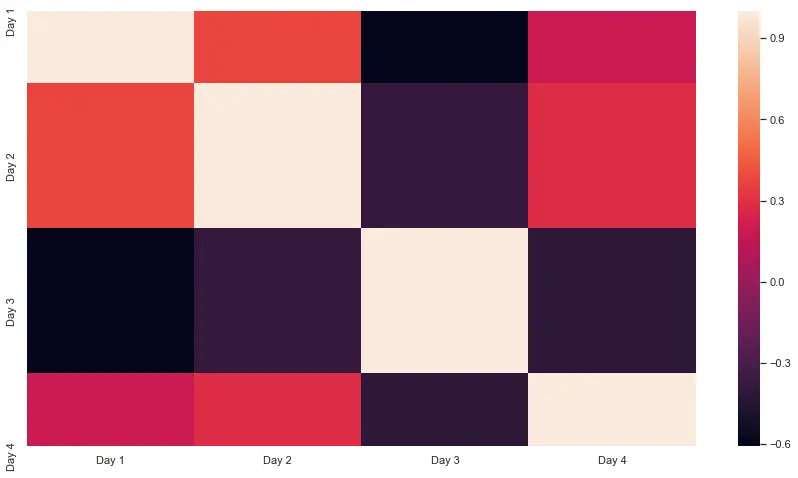
sns.set(rc={"figure.figsize": (15, 8)})
sns.heatmap(df.corr())

请注意,rc 参数的值被指定为字典。最终的高度和宽度作为元组传递。
使用 matplotlib.pyplot.figure() 函数设置 seaborn 热图大小
figure() 函数用于在 Python 中启动或自定义当前图形。此图中绘制了热图。可以使用函数中的 figsize 参数更改大小。
例如,
import pandas as pd
import matplotlib.pyplot as plt
import seaborn as sns

df = pd.DataFrame(
    {
        "Day 1": [7, 1, 5, 6, 3, 10, 5, 8],
        "Day 2": [1, 2, 8, 4, 3, 9, 5, 2],
        "Day 3": [4, 6, 5, 8, 6, 1, 2, 3],
        "Day 4": [5, 8, 9, 5, 1, 7, 8, 9],
    }
)


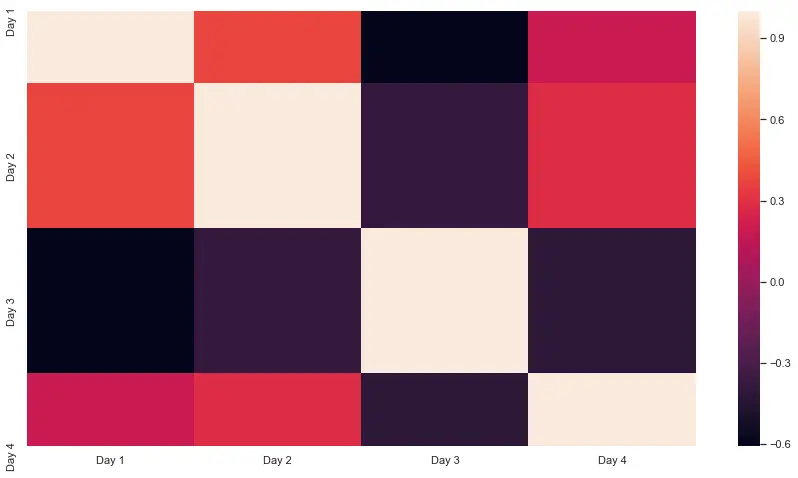
plt.figure(figsize=(15, 8))
sns.heatmap(df.corr())

请注意,该函数在 heatmap() 函数之前使用。
使用 matplotlib.pyplot.gcf() 函数设置 seaborn 图的大小
gcf() 函数返回图形的视图实例对象。可以使用 set_size_inches() 方法更改此对象的大小。通过这种方式,我们可以在这个对象上设置热图图的大小。
例如,
import pandas as pd
import matplotlib.pyplot as plt
import seaborn as sns

df = pd.DataFrame(
    {
        "Day 1": [7, 1, 5, 6, 3, 10, 5, 8],
        "Day 2": [1, 2, 8, 4, 3, 9, 5, 2],
        "Day 3": [4, 6, 5, 8, 6, 1, 2, 3],
        "Day 4": [5, 8, 9, 5, 1, 7, 8, 9],
    }
)


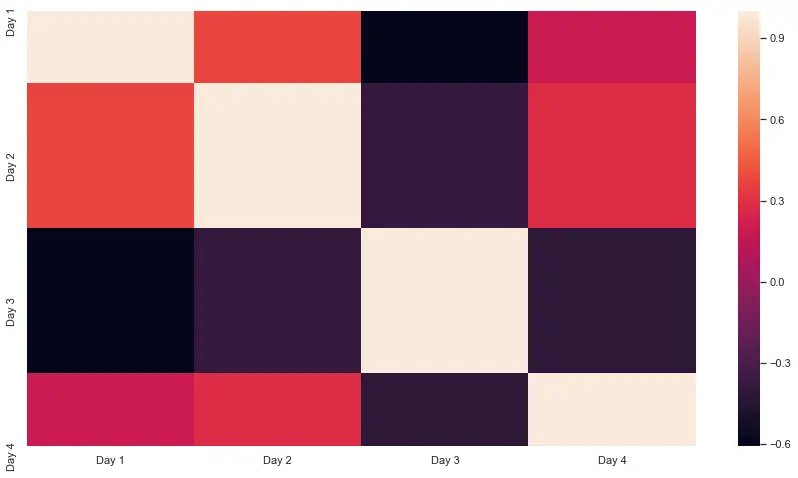
sns.heatmap(df.corr())
plt.gcf().set_size_inches(15, 8)

请注意,此方法在 heatmap() 函数之后使用。
另外需要注意的是,在上述所有方法中,热图中注释的大小并没有受到太大影响。
为了增加注释的大小,我们需要在 heatmap() 函数中将 annot 参数设置为 True。然后我们可以在 annot_kws 参数中将字体大小指定为键值对,如 annot_kws = {'size':15}。
Manav is a IT Professional who has a lot of experience as a core developer in many live projects. He is an avid learner who enjoys learning new things and sharing his findings whenever possible.
LinkedIn