在 R 中创建并排箱线图

本文将介绍在 R 中创建并排箱线图的方法。
在 R 中使用 par 函数创建并排箱线图
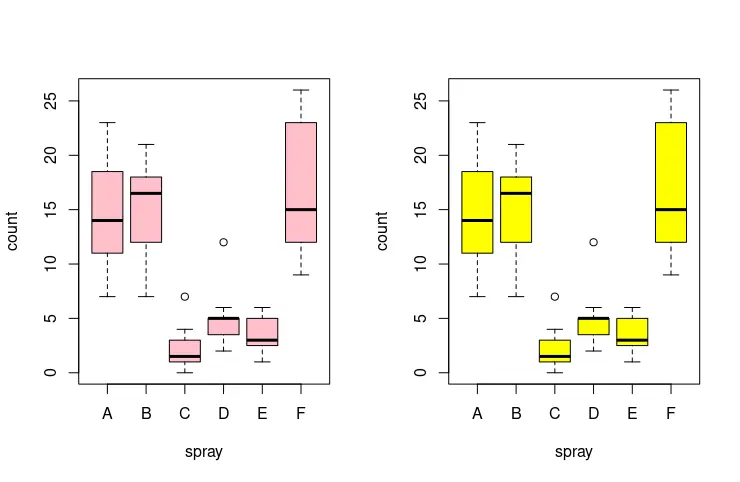
par 功能可用于设置图形参数。调用不带参数或 no.readonly = TRUE 的函数会检索所有图形参数。在这种情况下,我们使用 mfrow 参数来构建并排箱线图。mfrow 在 c(nr, nc) 向量中传递,随后的图绘制为 nr-by-nc 数组。以下示例代码从 InsectSprays 数据集构建了两个箱线图,其中相应地绘制了 count 和 spray 列。尽管对 boxplot 函数的深入审查超出了本文的范围,但它需要 col 参数来指定盒体的颜色。请注意,最后一个 par(mfrow=c(1,1)) 函数调用用于将布局重置为默认设置。
par(mfrow=c(1,2))
boxplot(count ~ spray, data = InsectSprays, col = "pink")
boxplot(count ~ spray, data = InsectSprays, col = "yellow")
par(mfrow=c(1,1))
在 R 中使用 grid.arrange 函数创建并排箱线图
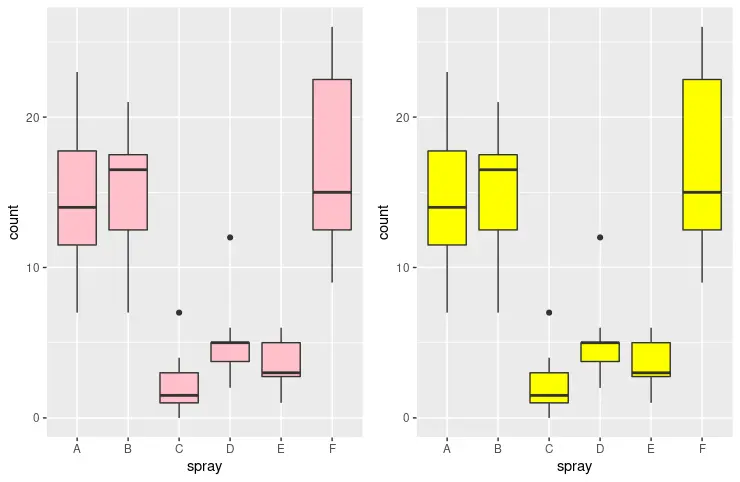
或者,我们可以使用 gridExtra 包中的 grid.arrange 函数。grid.arrange 的行为类似于 par 函数。尽管如此,它对于多个绘图更加灵活和直观,尤其是 ggplot 对象。grid.arrange 将可变长度的 ggplot 对象作为起始参数。之后,我们可以指定可选参数,即表示需要为绘图创建的列数的 ncol 参数。下一个代码片段绘制两个并排的箱线图。
library(ggplot2)
library(gridExtra)

plot1 <- ggplot(InsectSprays, aes(x = spray, y = count)) + geom_boxplot(fill = "pink")
plot2 <- ggplot(InsectSprays, aes(x = spray, y = count)) + geom_boxplot(fill = "yellow")
grid.arrange(plot1, plot2, ncol = 2)
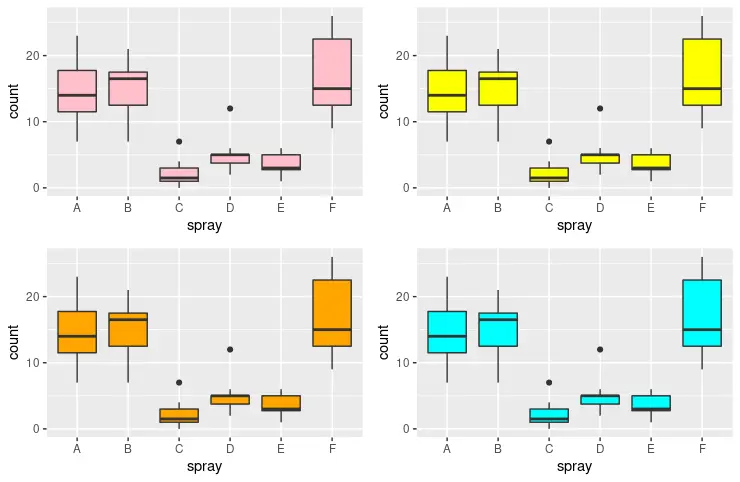
grid.arrange 还可以创建使用 nrow 和 ncol 参数指定的二维拆分窗口。请注意,ggplot 对象可以组合成一个列表,并以 grobs = list(...) 参数的形式传递。以下示例以 2×2 矩阵样式输出四个箱线图。
library(ggplot2)
library(gridExtra)

plot1 <- ggplot(InsectSprays, aes(x = spray, y = count)) + geom_boxplot(fill = "pink")
plot2 <- ggplot(InsectSprays, aes(x = spray, y = count)) + geom_boxplot(fill = "yellow")
plot3 <- ggplot(InsectSprays, aes(x = spray, y = count)) + geom_boxplot(fill = "orange")
plot4 <- ggplot(InsectSprays, aes(x = spray, y = count)) + geom_boxplot(fill = "cyan")
grid.arrange(plot1, plot2, plot3, plot4, nrow = 2, ncol = 2)
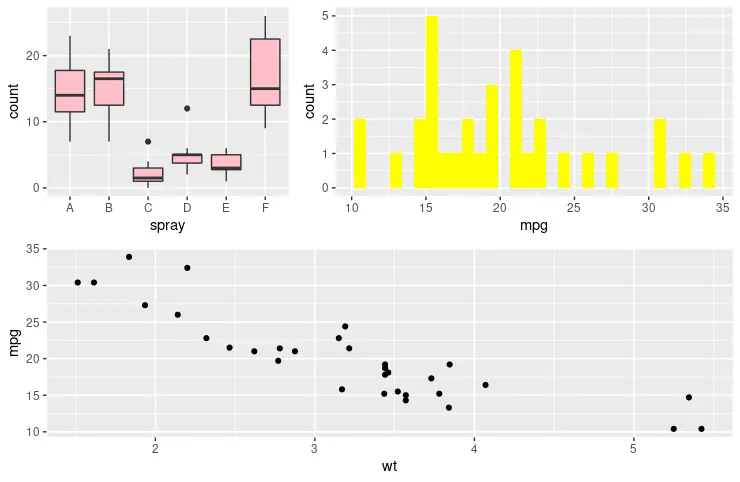
grid.arrange 函数的另一个有用参数是 layout_matrix,它将每个图定位在由组合向量指定的自定义结构中。该示例定义了以非对称窗口结构构建的三个不同绘图对象 - 顶部两个绘图和一个下方绘图。rbind 中向量的数量对应于窗口行,每个对象中的元素指定给定窗口行应该分成的部分数。同时,数字对应于相同顺序的参数图。如果第二行上的所有拆分窗口都应被第三个图占据,则第二个向量中的所有元素都应具有值 - 3。
library(ggplot2)
library(gridExtra)

plot1 <- ggplot(InsectSprays, aes(x = spray, y = count)) + geom_boxplot(fill = "pink")
plot2 <- ggplot(mtcars, aes(x = mpg)) + geom_histogram(fill = "yellow", bins = 30)
plot3 <- ggplot(mtcars, aes(x = wt, y = mpg)) + geom_point(fill = "orange")

grid.arrange(plot1, plot2, plot3, widths = c(2, 2, 1),
    layout_matrix = rbind(c(1, 2, 2), c(3, 3, 3)))

Founder of DelftStack.com. Jinku has worked in the robotics and automotive industries for over 8 years. He sharpened his coding skills when he needed to do the automatic testing, data collection from remote servers and report creation from the endurance test. He is from an electrical/electronics engineering background but has expanded his interest to embedded electronics, embedded programming and front-/back-end programming.
LinkedIn