R 中的 scale_colour_discrete 函数

本文将介绍如何在 R 中使用 scale_colour_discrete。
使用 scale_colour_discrete 修改 R 中的 colour 比例标签
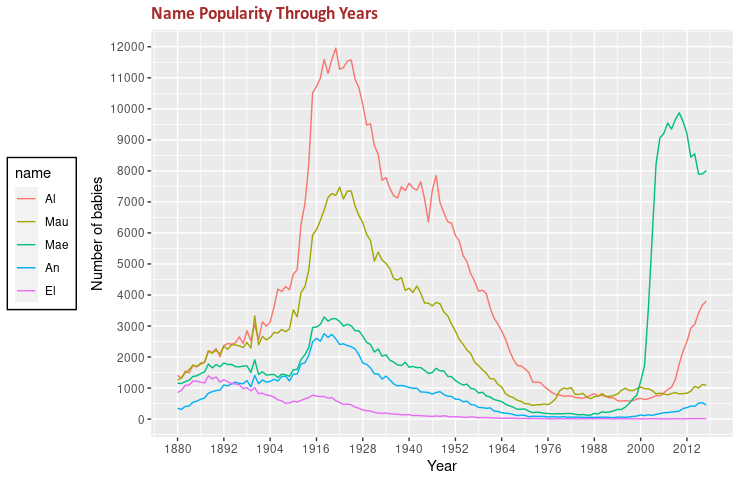
scale_colour_discrete 可用于修改通常需要具有离散值的 colour 比例标签。在这种情况下,我们演示了一个使用过滤后的 babynames 数据集的示例,从中仅提取了五个名字以使其更简单。我们使用 geom_line 绘制线图。x/y 轴上的映射变量是婴儿的数量和他们出生的年份。由于名称映射到 colour 比例,它们将有一个图例,其中不同的颜色被映射到每个其中。使用 scale_colour_discrete 函数的 labels 参数,我们可以传递一个值向量,我们可以用它来替换现有的比例标签。
library(ggplot2)
library(gridExtra)
library(babynames)
library(dplyr)

dat <- babynames %>%
  filter(name %in% c("Alice", "Maude", "Mae",
                     "Annie", "Ella")) %>% filter(sex=="F")

p3 <- ggplot(dat, aes(x = year, y = n, colour = name)) +
  geom_line() +
  scale_colour_discrete(
    labels = c("Al", "Mau", "Mae", "An", "El")) +
  scale_y_continuous(
    breaks = seq(0, 13000, 1000),
    name = "Number of babies") +
  scale_x_continuous(
    breaks = seq(1880, 2017, 12),
    name = "Year") +
  theme(
    legend.position = "left",
    legend.background = element_rect(fill = "white", colour = "black"),
    plot.title = element_text(
      size = rel(1.2), lineheight = .9,
      family = "Calibri", face = "bold", colour = "brown"
    )) +
  ggtitle("Name Popularity Through Years")

p3

使用 scale_colour_discrete 修改 R 中的 colour 比例名称
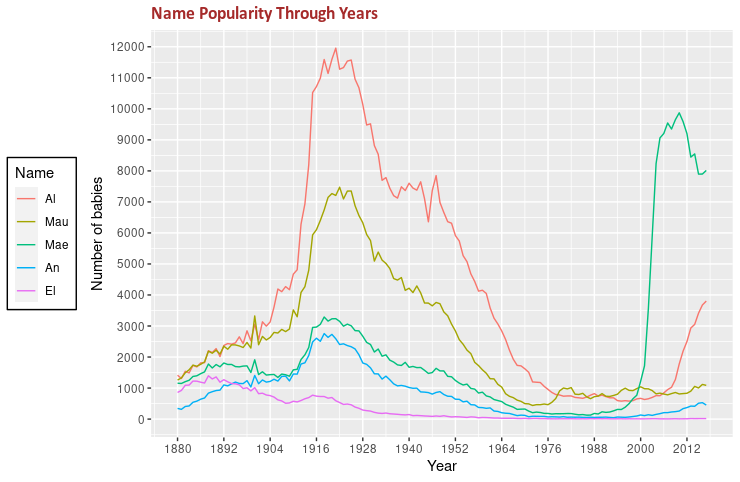
scale_colour_discrete 函数的另一个有用参数是 name,它控制 colour 刻度标题。自定义字符串值可以分配给 name 参数,这会在以下示例代码中生成修改后的图例名称。
library(ggplot2)
library(gridExtra)
library(babynames)
library(dplyr)

dat <- babynames %>%
  filter(name %in% c("Alice", "Maude", "Mae",
                     "Annie", "Ella")) %>% filter(sex=="F")

p3 <- ggplot(dat, aes(x = year, y = n, colour = name)) +
  geom_line() +
  scale_colour_discrete(
    name = "Name",
    labels = c("Al", "Mau", "Mae", "An", "El")) +
  scale_y_continuous(
    breaks = seq(0, 13000, 1000),
    name = "Number of babies") +
  scale_x_continuous(
    breaks = seq(1880, 2017, 12),
    name = "Year") +
  theme(
    legend.position = "left",
    legend.background = element_rect(fill = "white", colour = "black"),
    plot.title = element_text(
      size = rel(1.2), lineheight = .9,
      family = "Calibri", face = "bold", colour = "brown"
    )) +
  ggtitle("Name Popularity Through Years")


p3

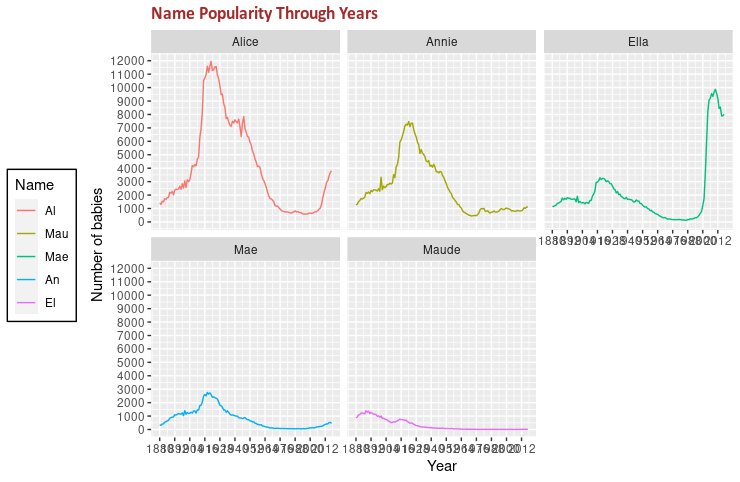
前面的图在单个面板上绘制所有线条,但我们可以使用 facet_wrap 函数在单独的一个面板上输出每条线。facet_wrap 将需要映射的变量作为第一个参数。
library(ggplot2)
library(gridExtra)
library(babynames)
library(dplyr)

dat <- babynames %>%
  filter(name %in% c("Alice", "Maude", "Mae",
                     "Annie", "Ella")) %>% filter(sex=="F")

p4 <- ggplot(dat, aes(x = year, y = n, colour = name)) +
  geom_line() +
  scale_colour_discrete(
    name = "Name",
    labels = c("Al", "Mau", "Mae", "An", "El")) +
  scale_y_continuous(
    breaks = seq(0, 13000, 1000),
    name = "Number of babies") +
  scale_x_continuous(
    breaks = seq(1880, 2017, 12),
    name = "Year") +
  theme(
    legend.position = "left",
    legend.background = element_rect(fill = "white", colour = "black"),
    plot.title = element_text(
      size = rel(1.2), lineheight = .9,
      family = "Calibri", face = "bold", colour = "brown"
    )) +
  ggtitle("Name Popularity Through Years") +
  facet_wrap(vars(name))

p4

Founder of DelftStack.com. Jinku has worked in the robotics and automotive industries for over 8 years. He sharpened his coding skills when he needed to do the automatic testing, data collection from remote servers and report creation from the endurance test. He is from an electrical/electronics engineering background but has expanded his interest to embedded electronics, embedded programming and front-/back-end programming.
LinkedIn