在 R 中绘制不同颜色的图例项

本文将演示如何在 R 中绘制不同颜色的图例项。
在 R 中使用 legend 函数为绘图添加图例
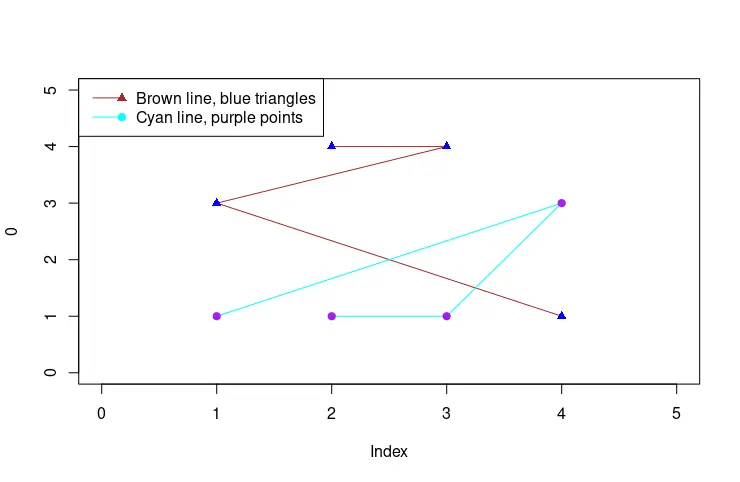
legend 函数用于在图上绘制图例对象。它需要 x 和 y 坐标作为前两个参数来指定图例的位置。虽然可以使用诸如"left"、"bottomright"等关键字来指定它。下一个参数称为 legend,它表示为需要在图例中显示的字符向量。在这种情况下,我们绘制由三角形或圆形表示的线和点。线和点有不同的颜色,它们需要相应地显示在图例中。以下代码片段仅在图例中绘制形状和文本。
library(ggplot2)

plot( 0, type = "n", xlim = c(0,5), ylim = c(0,5) )
A <- matrix( c( c(4,1,3,2), c(1,3,4,4)), ncol = 2 )
B <- matrix( c( c(1,4,3,2), c(1,3,1,1)), ncol = 2 )

lines( A, col = "brown" )
points( A, col = "blue", pch = 17 )
lines( B, col = "cyan" )
points( B, col = "purple", pch = 19 )


legend( x = "topleft",
        legend = c("Brown line, blue triangles","Cyan line, purple points"),
        col = c("blue","purple"), lwd = 2, lty = c(0,0),
        pch = c(17,19) )

我们还可以通过增加 lty 参数向量的值来添加行。请注意,那些对应于直线和不间断的线。另一方面,pch 参数表示映射到 0:25 整数值的绘图符号,并在 points 函数文档中进行了描述。
library(ggplot2)

plot( 0, type = "n", xlim = c(0,5), ylim = c(0,5) )
A <- matrix( c( c(4,1,3,2), c(1,3,4,4)), ncol = 2 )
B <- matrix( c( c(1,4,3,2), c(1,3,1,1)), ncol = 2 )

lines( A, col = "brown" )
points( A, col = "blue", pch = 17 )
lines( B, col = "cyan" )
points( B, col = "purple", pch = 19 )

legend( x = "topleft",
        legend = c("Brown line, blue triangles","Cyan line, purple points"),
        col = c("brown","cyan"), lwd = 1, lty = c(1,1),
        pch = c(17,19), merge = FALSE)
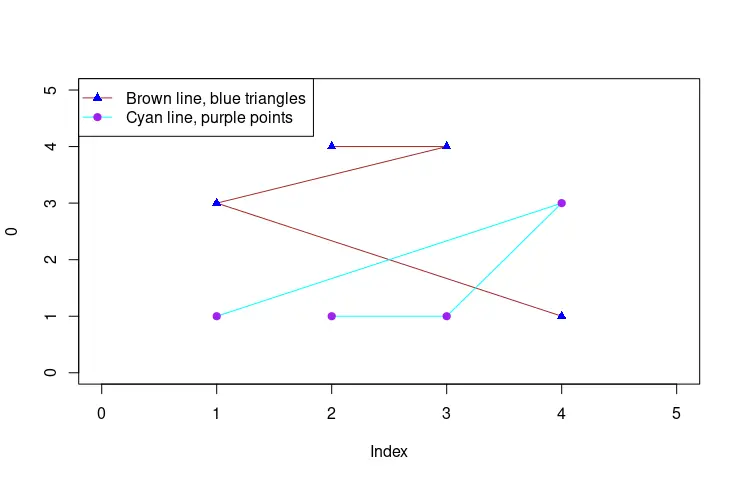
使用双 legend 调用绘制不同颜色的图例项
上一个示例显示具有相同颜色的单个项目的线条和形状。这可以通过 legend 函数的两次调用来解决,每个函数都用不同的颜色分别显示线条和形状。不过请注意,其中一个调用的 legend 参数应该具有空向量值。
library(ggplot2)

plot( 0, type = "n", xlim = c(0,5), ylim = c(0,5) )
A <- matrix( c( c(4,1,3,2), c(1,3,4,4)), ncol = 2 )
B <- matrix( c( c(1,4,3,2), c(1,3,1,1)), ncol = 2 )

lines( A, col = "brown" )
points( A, col = "blue", pch = 17 )
lines( B, col = "cyan" )
points( B, col = "purple", pch = 19 )


legend( x = "topleft",
        legend = c("Brown line, blue triangles","Cyan line, purple points"),
        col = c("brown","cyan"), lwd = 1, lty = c(1,1),
       pch = c(NA,NA) )

legend( x = "topleft",
        legend = c("",""),
        col = c("blue","purple"), lwd = 1, lty = c(0,0),
        pch = c(17,19), bty= 'n')

Founder of DelftStack.com. Jinku has worked in the robotics and automotive industries for over 8 years. He sharpened his coding skills when he needed to do the automatic testing, data collection from remote servers and report creation from the endurance test. He is from an electrical/electronics engineering background but has expanded his interest to embedded electronics, embedded programming and front-/back-end programming.
LinkedIn