R 中的列联表
Sheeraz Gul
2022年5月26日
列联表,也称为交叉表,是总结两个变量之间关系的表格。本教程演示如何在 R 中创建列联表。
R 中的列联表
在 R 中,创建列联表非常容易。假设我们有一个数据集,其中包含 20 名员工的信息,包括 id、办公室名称和员工职位。
要创建列联表,我们使用 R 中的 table 函数。参见示例:
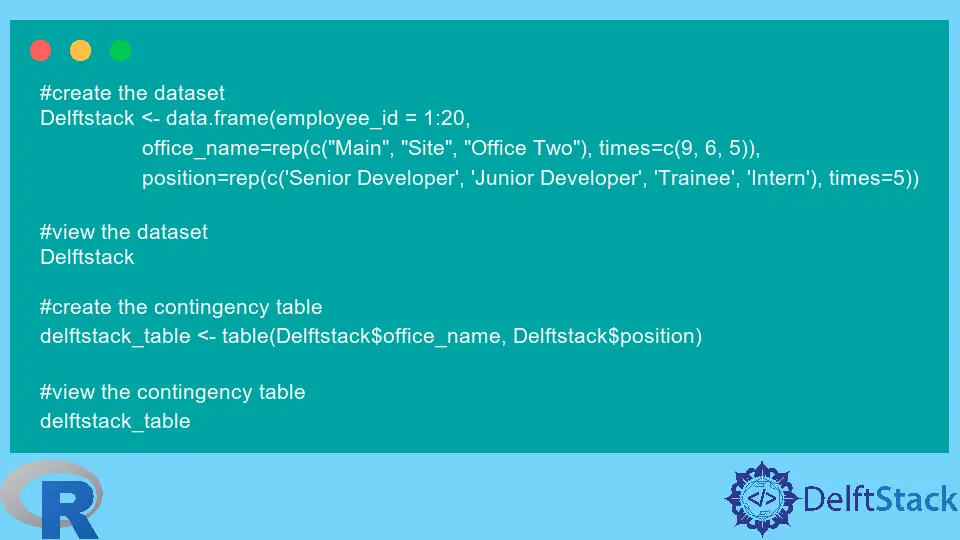
#create the dataset
Delftstack <- data.frame(employee_id = 1:20,
                 office_name=rep(c("Main", "Site", "Office Two"), times=c(9, 6, 5)),
                 position=rep(c('Senior Developer', 'Junior Developer', 'Trainee', 'Intern'), times=5))

#view the dataset
Delftstack

#create the contingency table
delftstack_table <- table(Delftstack$office_name, Delftstack$position)

#view the contingency table
delftstack_table
上面的代码将首先创建一个包含 20 条记录的数据集,然后从该数据集创建一个列联表。见输出:
   employee_id office_name         position
1            1        Main Senior Developer
2            2        Main Junior Developer
3            3        Main          Trainee
4            4        Main           Intern
5            5        Main Senior Developer
6            6        Main Junior Developer
7            7        Main          Trainee
8            8        Main           Intern
9            9        Main Senior Developer
10          10        Site Junior Developer
11          11        Site          Trainee
12          12        Site           Intern
13          13        Site Senior Developer
14          14        Site Junior Developer
15          15        Site          Trainee
16          16  Office Two           Intern
17          17  Office Two Senior Developer
18          18  Office Two Junior Developer
19          19  Office Two          Trainee
20          20  Office Two           Intern

             Intern Junior Developer Senior Developer Trainee
  Main            2                2                3       2
  Office Two      2                1                1       1
  Site            1                2                1       2
我们可以使用 addmargins() 函数向列联表添加边距。参见示例:
#add margins to contingency table
delftstack_margins <- addmargins(delftstack_table)

#view contingency table
delftstack_margins
上面的代码将为列联表添加边距。见输出:
             Intern Junior Developer Senior Developer Trainee Sum
  Main            2                2                3       2   9
  Office Two      2                1                1       1   5
  Site            1                2                1       2   6
  Sum             5                5                5       5  20
此输出显示员工总数为 20; 20 以上的数值表示对应办公室的员工总数,即办公室有 9 名员工,办公室二有 5 名员工,现场办公室有 6 名员工。中间的列显示了其职位的员工人数。
作者: Sheeraz Gul

Sheeraz is a Doctorate fellow in Computer Science at Northwestern Polytechnical University, Xian, China. He has 7 years of Software Development experience in AI, Web, Database, and Desktop technologies. He writes tutorials in Java, PHP, Python, GoLang, R, etc., to help beginners learn the field of Computer Science.
LinkedIn Facebook