在 Python 中绘制 ROC 曲线
在本指南中,我们将帮助你更多地了解这个 Python 函数以及你可以用来绘制 ROC 曲线作为程序输出的方法。
Python 中的 ROC 曲线定义
术语 ROC 曲线代表接收者操作特征曲线。该曲线基本上是任何分类模型在所有分类阈值下的性能的图形表示。
这条曲线有两个参数:
- 真阳性率(TPR) - 代表真实,即真实灵敏度
- False Positive Rate(FPR) - 代表伪,即假灵敏度
这两个参数都称为操作特性,并用作定义 ROC 曲线的因素。
在 Python 中,模型的效率是通过查看曲线下面积 (AUC) 来确定的。因此,效率最高的模型的 AUC 等于 1,效率最低的模型的 AUC 等于 0.5。
Python 中的 Scikit-Learn 库
Scikit-learn 库是用于在 Python 中执行机器学习的最重要的开源库之一。该库包含许多用于分类、聚类和回归等任务的工具。
在本教程中,使用了这个库中的几个函数来帮助绘制 ROC 曲线。这些功能是:
make_classification- 导入此函数是因为它通过创建点簇来帮助生成随机的 n 类分类问题。RandomForestClassifier- 此函数作为Random Forest Classifier导入,并用作本教程中制作 ROC 曲线的示例模型。train_test_split- 此函数用于将整个数据拆分为两个子集(Train和Test),用于训练和测试数据。roc_curve- 此函数用于返回给定模型的 ROC 曲线。
绘制 ROC 曲线的 Python 代码
import numpy as np
import pandas as pd
import matplotlib.pyplot as plt
import seaborn as sns
from sklearn.datasets import make_classification
from sklearn.ensemble import RandomForestClassifier
from sklearn.model_selection import train_test_split
from sklearn.metrics import roc_curve
def plot_roc_curve(fper, tper):
plt.plot(fper, tper, color='red', label='ROC')
plt.plot([0, 1], [0, 1], color='green', linestyle='--')
plt.xlabel('False Positive Rate')
plt.ylabel('True Positive Rate')
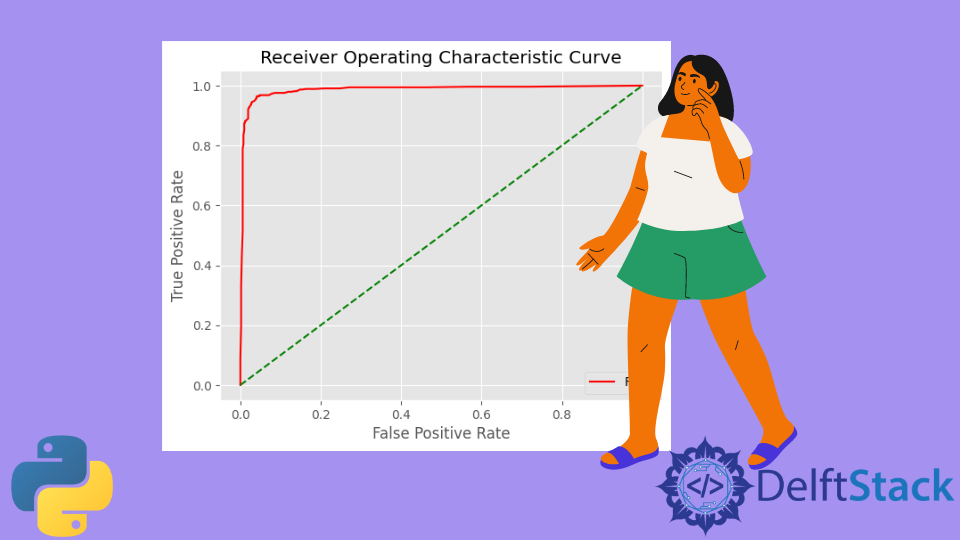
plt.title('Receiver Operating Characteristic Curve')
plt.legend()
plt.show()
data_X, cls_lab = make_classification(n_samples=2100, n_classes=2, weights=[1,1], random_state=2)
train_X, test_X, train_y, test_y = train_test_split(data_X, cls_lab, test_size=0.5, random_state=2)
model =RandomForestClassifier()
model.fit(train_X, train_y)
prob = model.predict_proba(test_X)
prob = probs[:, 1]
fper, tper, thresholds = roc_curve(test_y, prob)
plot_roc_curve(fper, tper)
输出:
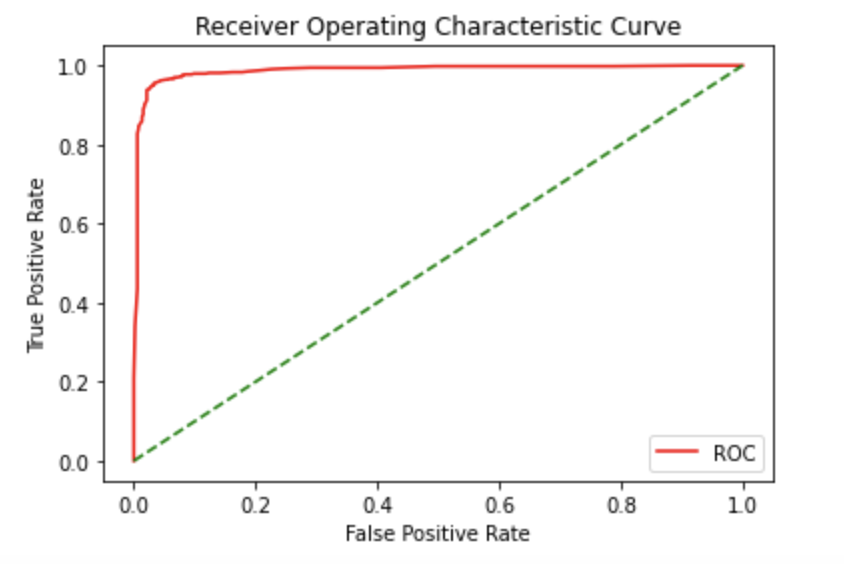
代码说明
首先,导入绘制 ROC 曲线所需的所有库和函数。然后定义了一个名为 plot_roc_curve 的函数,其中使用 Matplotlib 库提到了曲线的所有关键因素,如颜色、标签和标题。之后,使用 make_classification 函数制作随机样本,然后在 train_test_split 函数的帮助下将它们分为 train 和 test 集。在这里,数据的 train-test 比率是 0.50。然后使用 RandomForestClassifier 算法来拟合 train_X 和 train_y 数据。最后,roc_curve 函数用于绘制 ROC 曲线。

Lakshay Kapoor is a final year B.Tech Computer Science student at Amity University Noida. He is familiar with programming languages and their real-world applications (Python/R/C++). Deeply interested in the area of Data Sciences and Machine Learning.
LinkedIn