Python 中的二项分布
Manav Narula
2023年1月30日

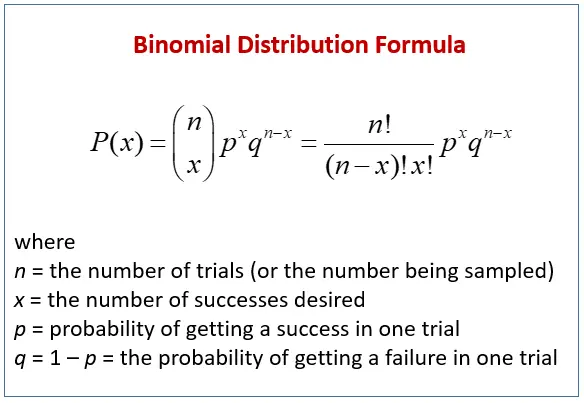
二项分布是概率和统计的基本概念。当成功和失败的概率已知时,它表示给定数量的独立实验的实际结果。仅当一个单独的事件(例如抛硬币)恰好可能出现 2 个结果时,才有可能。其数学公式如下所示。

本教程将演示如何在 Python 中创建二项分布。
在 Python 中使用 numpy.random.binomial() 函数创建二项分布
numpy 模块可以在 numpy 数组中生成一系列随机值。我们可以使用 numpy.random.binomial() 函数返回此分布的样本。
我们可以指定试验次数 (n)、成功概率 (p) 和最终输出的大小 (size) 作为函数中的参数。
例如,
import numpy as np

a = np.random.binomial(n=5, p=0.7, size=20)
print(a)
输出:
[5 4 2 3 2 4 4 3 3 3 4 2 3 4 3 4 5 5 2 2]
在上面的示例中,每个值表示在成功概率为 0.7 的 5 次试验期间事件发生的次数。对大小为 20 的样本重复此操作。
我们也可以使用 seaborn.distplot() 函数来绘制它。
例如,
import matplotlib.pyplot as plt
import seaborn as sns
import numpy as np

a = np.random.binomial(n=5, p=0.7, size=20)
sns.distplot(a, hist=True, kde=False)
plt.show()
输出:

在 Python 中使用 scipy.stats.binom.pmf() 函数创建二项式概率分布
scipy.stats.binom.pmf() 函数返回某些给定值的二项式概率。我们可以使用它来创建二项式概率的分布。
它与以前的分布不同。我们将循环创建此分布所需的成功次数。
例如,
from scipy.stats import binom

n = 5
p = 0.7
s = list(range(n + 1))
a = [binom.pmf(r, n, p) for r in s]
print(a)
sns.distplot(a, hist=True, kde=False)
plt.show()
输出:

作者: Manav Narula
Manav is a IT Professional who has a lot of experience as a core developer in many live projects. He is an avid learner who enjoys learning new things and sharing his findings whenever possible.
LinkedIn