使用 Pandas DataFrame 创建饼图
Luqman Khan
2024年2月15日
- 使用 Pandas DataFrame 创建一个简单的饼图
- 使用 Pandas DataFrame 创建百分比饼图
- 使用 Pandas DataFrame 创建带颜色的饼图
- 使用 Pandas DataFrame 创建具有爆炸效果的饼图
- 使用 Pandas DataFrame 创建具有阴影效果的饼图
- 使用 Pandas DataFrame 创建具有起始角度的饼图
- 结论
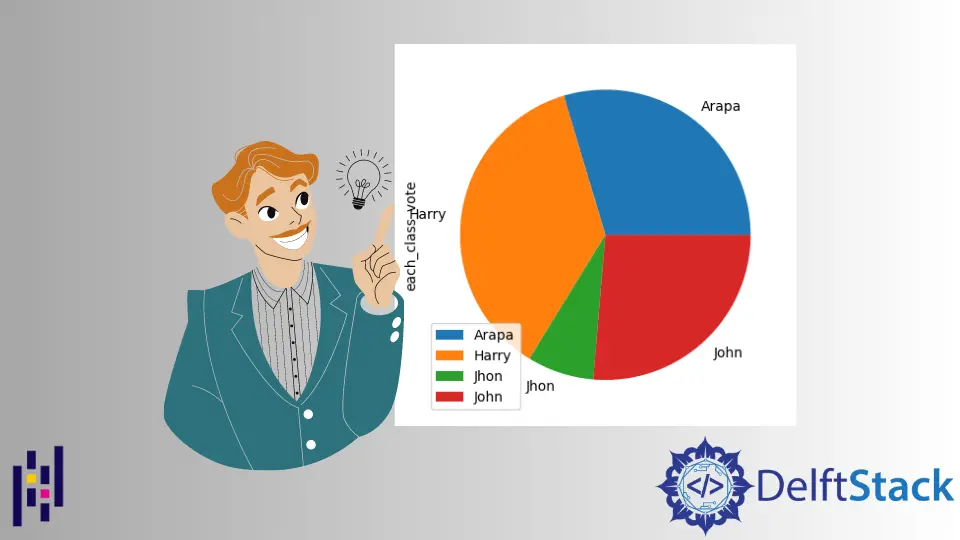
饼图表示圆形图中的数据,通常用于研究、工业和商业。
饼图段代表数据的相对强度并用作其图形表示。饼图需要一个类别列表和数值变量。
馅饼的总价值总是 100%。
本文将介绍 Python Pandas 库如何使用 DataFrame 创建饼图。
使用 Pandas DataFrame 创建一个简单的饼图
在创建 DataFrame 并将其保存在变量 data_frame 之前,我们必须首先导入 Pandas 库。此 DataFrame 包含两列:一列用于每个学生的姓名,另一列用于每个学生的投票数。
import pandas as pd
现在,data_frame 变量存储两列的数据。
data_frame = pd.DataFrame(
    {
        "Name": [
            "John",
            "John",
            "John",
            "Jhon",
            "John",
            "Arapa",
            "Arapa",
            "Arapa",
            "Arapa",
            "Arapa",
            "Harry",
            "Harry",
            "Harry",
            "Harry",
            "Harry",
        ],
        "each_class_vote": [22, 12, 10, 18, 20, 17, 16, 13, 12, 14, 22, 19, 11, 19, 18],
    }
)
data_frame
输出:
     Name    No_of_vote
0    John    22
1    John    12
2    John    10
3    Jhon    18
4    John    20
5    Arapa   17
6    Arapa   16
7    Arapa   13
8    Arapa   12
9    Arapa   14
10   Harry   22
11   Harry   19
12   Harry   11
13   Harry   19
14   Harry   18
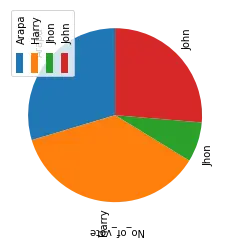
我们将使用带有属性 kind 的 plot() 函数绘制上述 data_frame 的饼图。
data_frame.groupby(["Name"]).sum().plot(kind="pie", y="No_of_vote")
输出:
使用 Pandas DataFrame 创建百分比饼图
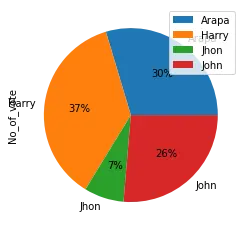
要添加另一个属性,请使用 autopct 及其值。此属性将百分比添加到饼图。
data_frame.groupby(["Name"]).sum().plot(kind="pie", y="No_of_vote", autopct="%1.0f%%")
使用 Pandas DataFrame 创建带颜色的饼图
要在饼图中添加属性颜色,我们设置颜色列表。
语法:
plot(kind='pie', colors)
创建一个变量 colors 并使用颜色名称分配颜色列表。
colors = ["pink", "silver", "steelblue", "blue"]
data_frame.groupby(["Name"]).sum().plot(
    kind="pie", y="No_of_vote", autopct="%1.0f%%", colors=colors
)
输出:
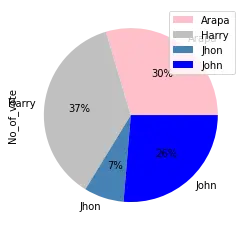
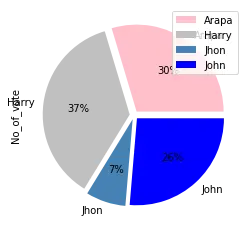
上面的输出显示颜色列表根据学生的姓名设置了 4 种颜色。
使用 Pandas DataFrame 创建具有爆炸效果的饼图
分解饼图的过程是将其拆分为多个部分。为此,我们使用 explode 属性并将其分配给适当的值。
plot(kind='pie', explode)
创建一个名为 explode 的变量并将比率分配给它。
explode = (0.05, 0.05, 0.05, 0.05)
data_frame.groupby(["Name"]).sum().plot(
    kind="pie", y="No_of_vote", autopct="%1.0f%%", colors=colors, explode=explode
)
输出:
使用 Pandas DataFrame 创建具有阴影效果的饼图
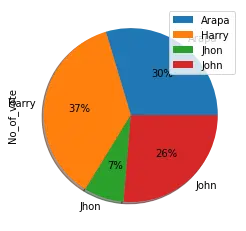
使用值为 True 的阴影属性在饼图中添加阴影效果。这为饼图增加了一个额外的维度。
plot(kind='pie', shadow=True)
data_frame.groupby(["Name"]).sum().plot(
    kind="pie", y="No_of_vote", autopct="%1.0f%%", shadow=True
)
输出:
使用 Pandas DataFrame 创建具有起始角度的饼图
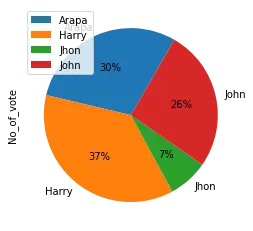
如果我们想将饼图旋转到不同的角度,请使用此属性及其适当的值。
语法:
plot(kind='pie', startangle)
将图表旋转 90 度
data_frame.groupby(["Name"]).sum().plot(
    kind="pie", y="votes_of_each_class", autopct="%1.0f%%", startangle=60
)
结论
在上面的文章中,首先,我们创建具有 2 列的 DataFrame,然后使用 Pandas 模块的 plot() 函数绘制饼图。之后,我们对饼图应用了不同的属性和效果。