如何保存与 Matplotlib 中显示的图形相同的图
Suraj Joshi
2024年2月15日

在使用 matplotlib.pyplot.savefig() 保存图时,我们有一个名为 dpi 的参数,它指定了文字的相对大小和线条上的笔画宽度。默认情况下,matplotlib.pyplot.show() 的 dpi 值是 80,而 matplotlib.pyplot.savefig() 的 dpi 默认值是 100。
为了确保 show() 和 savefig() 方法的图看起来是一样的,我们必须在 savefig() 方法中使用 dpi=fig.dpi。我们也可以在 matplotlib.pyplot.fig() 方法中设置 figsize 参数来调整图的绝对尺寸,使两个图的尺寸相同。
在 savefig() 方法中设置 dpi=fig.dpi,可以保存与 Matplotlib 中显示的图形相同的图形
import matplotlib.pyplot as plt

x = [1, 3, 4, 5, 8]
y = [3, 1, 5, 4, 9]

fig = plt.figure()
plt.plot(x, y)
plt.xlabel("X")
plt.ylabel("Y")
plt.title("X vs Y")
fig.savefig("plot.png", dpi=fig.dpi)
plt.show()
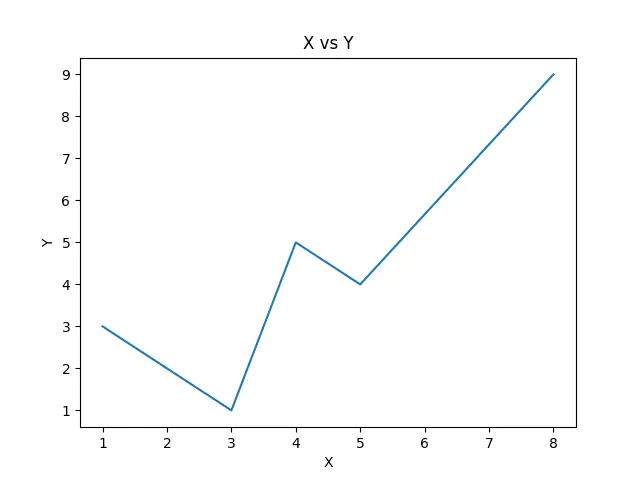
输出:

保存的图形:

这个过程会将图形保存为 plot.png,与显示的图形相同。
有时,我们可能会在创建的图上得到很大的边框。为了解决这个数值,我们可以使用 matplotlib.pyplot.tight_layout() 方法,或者在 savefig() 方法中设置 bbox_inches='tight'。
import matplotlib.pyplot as plt

x = [1, 3, 4, 5, 8]
y = [3, 1, 5, 4, 9]

fig = plt.figure()
plt.plot(x, y)
plt.xlabel("X")
plt.ylabel("Y")
plt.title("X vs Y")
fig.savefig("plot.png", dpi=fig.dpi, bbox_inches="tight")
plt.show()
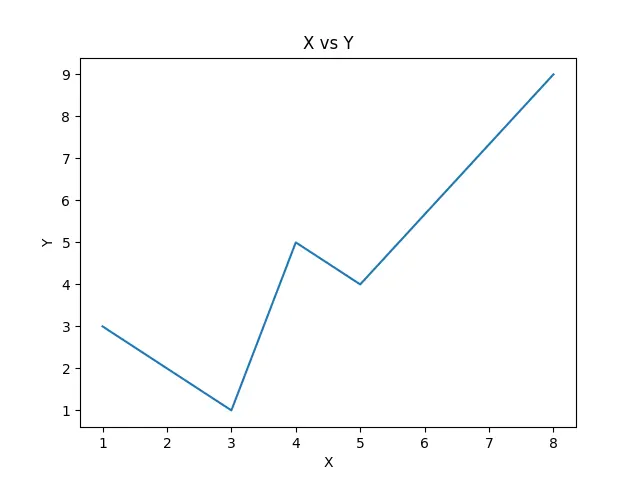
输出:

保存的图形:

作者: Suraj Joshi
Suraj Joshi is a backend software engineer at Matrice.ai.
LinkedIn