Python Matplotlib 图中的上标

本教程将讨论在 Python 中使用美元符号在图中编写上标。
使用美元符号在 Matplotlib 图中写上标
我们使用 Matplotlib 在 Python 中绘制图形。有时,我们需要为绘图添加标签,包括下标或上标。Matplotlib 还提供了一种使用美元符号编写下标或上标的方法。要制作下标,你必须使用 _ 和 ^ 符号在美元符号内编写表达式。如果你使用 _ 符号,则上标将位于字符下方。如果你使用 ^ 符号,上标将位于字符上方。例如,让我们使用 Matplotlib 创建一个绘图并使用美元符号添加上标。请参阅下面的代码。
import matplotlib.pyplot as plt

fig, ax = plt.subplots()
ax.set(title=r"$e^{-t}$", xlabel=r"$time_s$", ylabel=r"$m^2$")
plt.show()
输出:
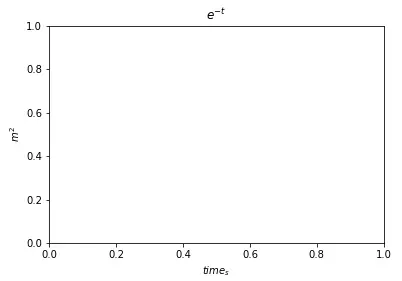
正如你在图中所见,-t 位于字符 e 上方,因为我们使用了 ^ 符号,而 s 位于字符串时间下方,因为我们使用了 _ 符号。如果下标或上标由多个字符组成,则将上标放在大括号 {} 内,否则;只有第一个字符会出现在上标或下标中。例如,我们在图标题中使用了大括号,因为上标有两个字符。如果你想在图中放置特殊符号,例如 alpha 或饼图符号,你可以使用 Matplotlib 中的预定义符号。要使用符号,你必须将符号名称与反斜杠一起写入。例如,让我们在上图中放置一些特殊符号,如饼图和阿尔法。请参阅下面的代码。
import matplotlib.pyplot as plt

fig, ax = plt.subplots()
ax.set(title=r"$\alpha^{-t}$", xlabel=r"$\tau_s$", ylabel=r"$\pi^2$")
plt.show()
输出:
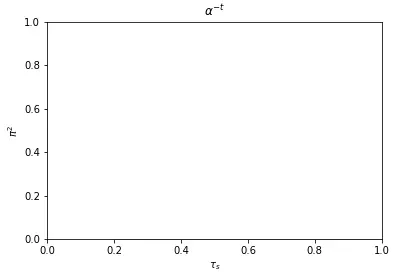
正如你在图中所见,有 alpha、pie 和 tau 符号。确保使用正确的符号名称和反斜杠;否则会出错。如果你希望上标文本与文本的其余部分使用相同的字体,请使用\mathregular。检查此链接以查找所有支持的符号以及有关下标和上标的更多信息。

Maisam is a highly skilled and motivated Data Scientist. He has over 4 years of experience with Python programming language. He loves solving complex problems and sharing his results on the internet.
LinkedIn