Matplotlib 标记散点
Suraj Joshi
2023年1月30日

为了给 Matplotlib 中的散点图标记散点,我们可以使用 matplotlib.pyplot.annotate() 函数,在指定的位置添加一个字符串。同样,我们也可以使用 matplotlib.pyplot.text() 函数为散点图点添加文字标签。
使用 matplotlib.pyplot.annotate() 函数为散点图点添加标签
matplotlib.pyplot.annotate(text, xy, *args, **kwargs)
它用 text 参数的值对点 xy 进行注释。xy 代表要注释的点的坐标 (x, y)。
import numpy as np
import matplotlib.pyplot as plt

np.random.seed(20)

X = np.random.randint(10, size=(5))
Y = np.random.randint(10, size=(5))

annotations = ["Point-1", "Point-2", "Point-3", "Point-4", "Point-5"]

plt.figure(figsize=(8, 6))
plt.scatter(X, Y, s=100, color="red")
plt.xlabel("X")
plt.ylabel("Y")
plt.title("Scatter Plot with annotations", fontsize=15)
for i, label in enumerate(annotations):
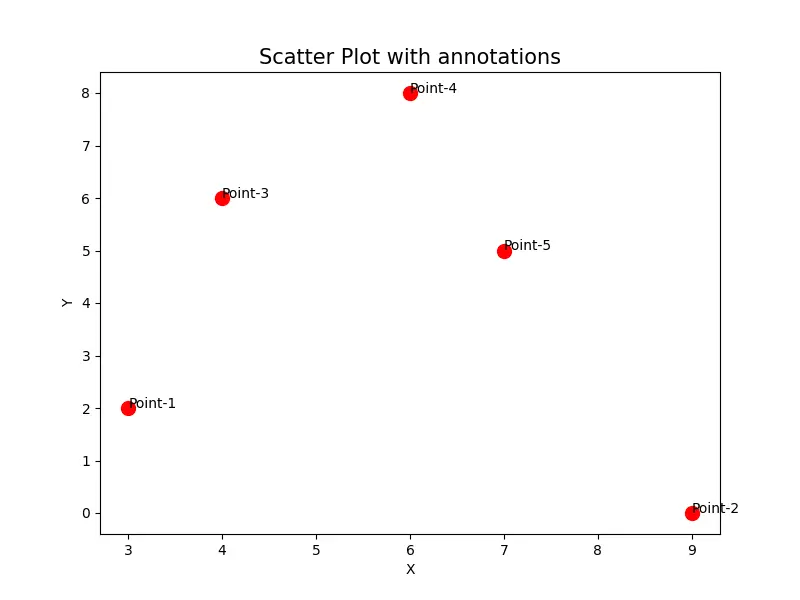
    plt.annotate(label, (X[i], Y[i]))

plt.show()
输出:

它创建了两个随机数组,X 和 Y,分别代表点的 X 坐标和 Y 坐标。我们有一个名为 annotations 的列表,长度与 X 和 Y 相同,其中包含每个点的标签。最后,我们通过循环迭代,使用 annotate() 方法为散点图中的每个点添加标签。
使用 matplotlib.pyplot.text() 函数为散点图点添加标签
matplotlib.pyplot.text(x, y, s, fontdict=None, **kwargs)
这里,x 和 y 代表我们需要放置文字的坐标,s 是需要添加的文字内容。
该函数在 x 和 y 指定的点上添加文字 s,其中 x 代表该点的 X 坐标,y 代表 Y 坐标。
import numpy as np
import matplotlib.pyplot as plt

np.random.seed(20)

X = np.random.randint(10, size=(5))
Y = np.random.randint(10, size=(5))

annotations = ["Point-1", "Point-2", "Point-3", "Point-4", "Point-5"]

plt.figure(figsize=(8, 6))
plt.scatter(X, Y, s=100, color="red")
plt.xlabel("X")
plt.ylabel("Y")
plt.title("Scatter Plot with annotations", fontsize=15)
for i, label in enumerate(annotations):
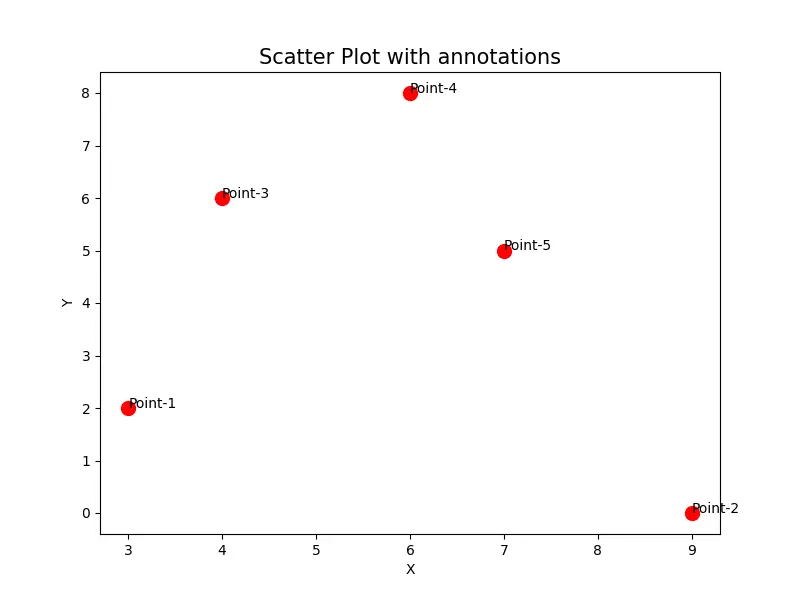
    plt.text(X[i], Y[i], label)

plt.show()
输出:

它通过循环执行,使用 matplotlib.pyplot.text() 方法为散点图中的每个点添加标签。
作者: Suraj Joshi
Suraj Joshi is a backend software engineer at Matrice.ai.
LinkedIn