使用 Matplotlib 创建多个子图

如果你想要额外的绘图或使用更多面向对象的绘图,最好使用 subplots 方法创建绘图。许多人更喜欢以这种方式创建他们的图,即使他们只创建一个图。
在本教程中,你将学习使用 matplotlib 包提供的子图功能,以在 Python 中在一个图形中创建和显示多个图。
使用 Matplotlib 中的 subplots() 方法创建绘图
当你尝试绘制多个子图时,它会多次发生,因此你发现使用循环和自动绘制多个图非常困难。
要创建绘图,我们将使用以下代码将别名 matplotlib.pyplot 导入为 "plt"。
import matplotlib.pyplot as plt
导入 matplotlib.pyplot 后。使用 'seabourn' 样式让这些图看起来稍微好一些。
plt.style.use("seaborn")
subplots() 方法有助于在单个窗口或图形中创建多个绘图,并且此方法返回两个内容。第一个是图形,第二个是轴,用于在不同轴上创建子图。
我们还没有定义应该在图中创建多少行和列,因为这是用于基本理解 Matplotlib 的单图示例。在下一小节中,我们将了解如何在一个图中创建多个图。
以下代码 subplots() 方法采用 figsize 参数。此参数接受具有宽度和高度的元组。
fig, axes = plt.subplots(figsize=(6, 4))
我们将为带有数值数据的 x1 和 y1 变量创建依赖和独立列表变量(x 和 y 坐标)。
x1 = [0, 4, 8, 12, 16, 20, 24]
y1 = [8, 1, 10, 5, 12, 16, 7]
以下代码示例是 Matplotlib 中的单线图。
示例代码:
import matplotlib.pyplot as plt

# use stylish plot from seaborn
plt.style.use("seaborn")

# create single plot in a figure
fig, axes = plt.subplots(figsize=(6, 4))

x1 = [0, 4, 8, 12, 16, 20, 24]
y1 = [8, 1, 10, 5, 12, 16, 7]
# Creates a line plot
axes.plot(x1, y1)
# set the title of appeared window
axes.set_title("A single Line-plot")

plt.show()
输出:
-Method-in-Matplotlib.webp)
使用 Matplotlib 在一个方向上创建两个子图
在 Matplotlib 中,图形是保存我们绘图的容器。你可以将其视为运行代码时向我们显示的整个窗口。
轴是实际的图,因此一个图形可以有多个图。现在我们将看到如何在一个图中处理两个图。
要在 Matplotlib 中创建多个图,我们需要使用两个变量定义 subplots() 方法。
fig, axes = plt.subplots(2, figsize=(6, 4))
subplots() 方法的前两个参数是可选的。在上面的代码中,我们在一行中创建了两个图。
默认情况下,如果我们不定义这些值,行和列的值将是 1。
现在我们将使用 axes 变量设置绘图的轴,axes 就像给定索引可以下注的数组。每个轴将单独显示绘图。
axes[0].plot(x1, y1)
axes[1].plot(x2, y2)
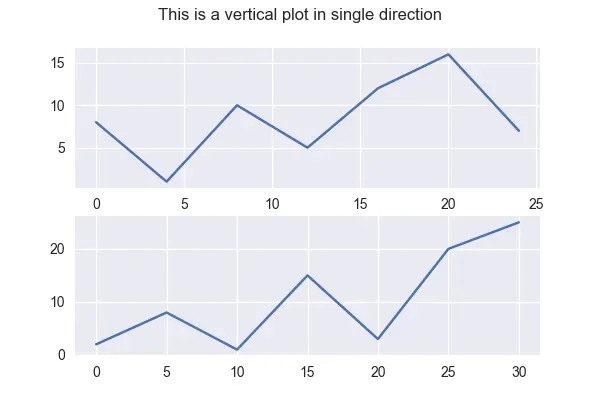
下面是单个方向上两个垂直子图的片段。
示例代码:
import matplotlib.pyplot as plt

# use stylish plot from seaborn
plt.style.use("seaborn")

# create single plot in a figure
fig, axes = plt.subplots(2, figsize=(6, 4))

x1 = [0, 4, 8, 12, 16, 20, 24]
y1 = [8, 1, 10, 5, 12, 16, 7]

# second dataset

x2 = [0, 5, 10, 15, 20, 25, 30]
y2 = [2, 8, 1, 15, 3, 20, 25]

# Creates a line plot
axes[0].plot(x1, y1)
axes[1].plot(x2, y2)

# displays a super title on top of the figure
fig.suptitle("This is a vertical plot in single direction")
plt.show()
输出:

在 Matplotlib 中的一个图中创建多个子图
默认情况下,子图创建一个图形,然后指定一定数量的轴的行和列。如果不传入我们的行数和列数,默认是一个一个的,所以一行一列就是一个轴。
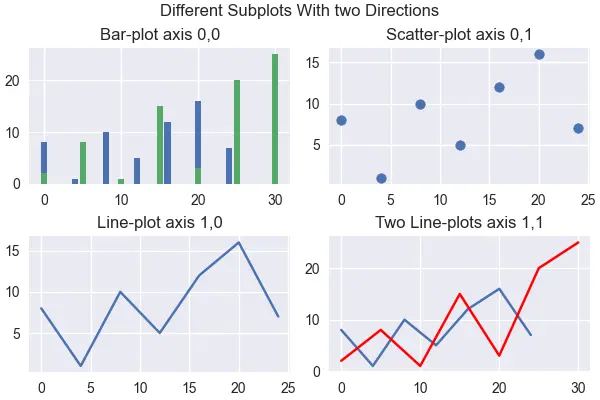
让我们更新我们的代码以在我们刚刚使用 subplots() 方法创建的多个轴上绘图。我们在此代码中使用最简单的方法来使用带有子图的轴。
为了简短起见,我们用一行代码来演示如何在 Matplotlib 中使用轴来显示多个子图。我们可以将此代码与二维数组相关联。
子图已被限制为二维,因为我们创建了一个 2 乘 2 的子图,因此我们不能给出大于两个的子图。我们可以使用相同的轴方法单独设置子图的标题。
axes[0][0].bar(x1, y1)
这是本节的完整源代码。
示例代码:
import matplotlib.pyplot as plt

# use stylish plot from seaborn
plt.style.use("seaborn")

# create single plot in a figure
fig, axes = plt.subplots(2, 2, figsize=(6, 4), constrained_layout=True)

x1 = [0, 4, 8, 12, 16, 20, 24]
y1 = [8, 1, 10, 5, 12, 16, 7]

# second dataset

x2 = [0, 5, 10, 15, 20, 25, 30]
y2 = [2, 8, 1, 15, 3, 20, 25]

# set the title of appeared window
axes[0][0].set_title("Bar-plot axis 0,0")
axes[0][1].set_title("Scatter-plot axis 0,1")
axes[1][0].set_title("Line-plot axis 1,0")
axes[1][1].set_title("Two Line-plots axis 1,1")

# Creates a line plot
axes[0][0].bar(x1, y1)
axes[0][0].bar(x2, y2)
axes[0][1].scatter(x1, y1)
axes[1][0].plot(x1, y1)
axes[1][1].plot(x1, y1)
axes[1][1].plot(x2, y2, color="red")

# displays a super title on top of the figure
fig.suptitle("Different Subplots With two Directions")
plt.show()
输出:

点击这里阅读关于子图的官方文档。
Hello! I am Salman Bin Mehmood(Baum), a software developer and I help organizations, address complex problems. My expertise lies within back-end, data science and machine learning. I am a lifelong learner, currently working on metaverse, and enrolled in a course building an AI application with python. I love solving problems and developing bug-free software for people. I write content related to python and hot Technologies.
LinkedIn