Matplotlib Python 中的线型
Suraj Joshi
2024年2月15日

本教程主要介绍了我们如何在 Matplotlib plot 中通过设置 matplotlib.pyplot.plot() 方法中 linestyle 参数的适当值来使用不同的线型。我们有很多 linestyle 的选项。
在 Matplotlib Python 中设置线条样式
import math
import numpy as np
import matplotlib.pyplot as plt

x = np.linspace(0, 2 * math.pi, 100)
y = np.sin(x)

plt.plot(x, y)
plt.xlabel("x")
plt.ylabel("sinx")
plt.title("Sinx Function")
plt.show()
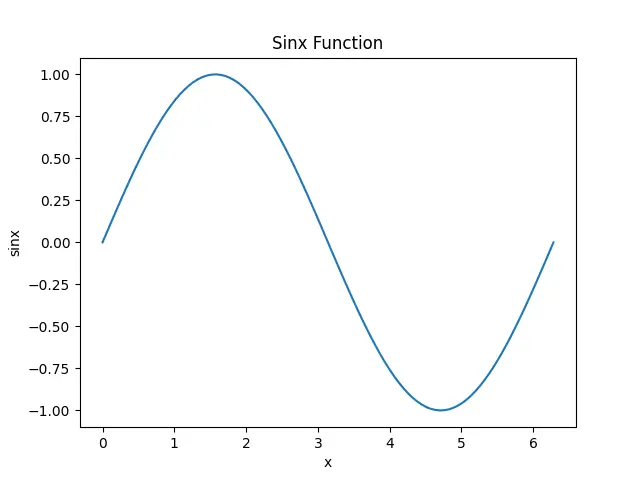
输出:

它以默认的实线样式生成 sinx 函数的图形。
要查看 linestyle 参数的选择,我们可以执行以下脚本。
from matplotlib import lines

print(lines.lineStyles.keys())
输出:
dict_keys(['-', '--', '-.', ':', 'None', ' ', ''])
我们可以使用任何一个输出值来改变图形的线型。
import math
import numpy as np
import matplotlib.pyplot as plt

x = np.linspace(0, 2 * math.pi, 100)
y = np.sin(x)

plt.plot(x, y, linestyle="-.")
plt.xlabel("x")
plt.ylabel("sinx")
plt.title("Sinx Function")
plt.show()
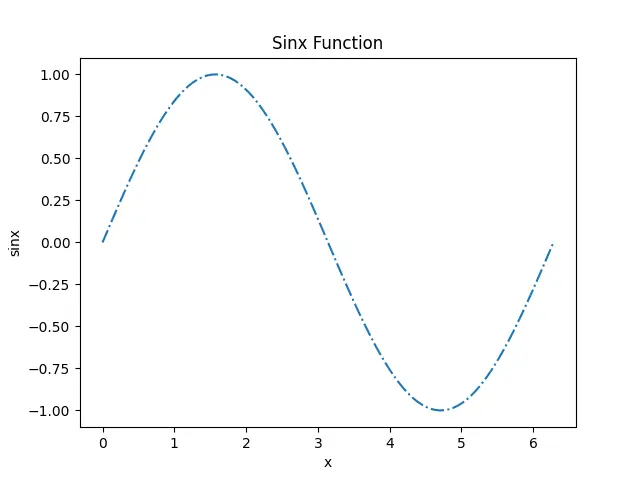
输出:

它将我们绘图中的线条样式设置为 -.。
Matplotlib Linestyle 文档提供了一个字典,我们可以用它来对线型进行更精细的控制。根据文档,我们可以用 (offset, (on_off_seq)) 元组来设置行样式。
import math
import numpy as np
import matplotlib.pyplot as plt

from collections import OrderedDict

linestyles_dict = OrderedDict(
    [
        ("solid", (0, ())),
        ("loosely dotted", (0, (1, 10))),
        ("dotted", (0, (1, 5))),
        ("densely dotted", (0, (1, 1))),
        ("loosely dashed", (0, (5, 10))),
        ("dashed", (0, (5, 5))),
        ("densely dashed", (0, (5, 1))),
        ("loosely dashdotted", (0, (3, 10, 1, 10))),
        ("dashdotted", (0, (3, 5, 1, 5))),
        ("densely dashdotted", (0, (3, 1, 1, 1))),
        ("loosely dashdotdotted", (0, (3, 10, 1, 10, 1, 10))),
        ("dashdotdotted", (0, (3, 5, 1, 5, 1, 5))),
        ("densely dashdotdotted", (0, (3, 1, 1, 1, 1, 1))),
    ]
)

x = np.linspace(0, 2 * math.pi, 100)
y = np.sin(x)

plt.plot(x, y, linestyle=linestyles_dict["loosely dashdotdotted"])
plt.xlabel("x")
plt.ylabel("sinx")
plt.title("Sinx Function")
plt.show()
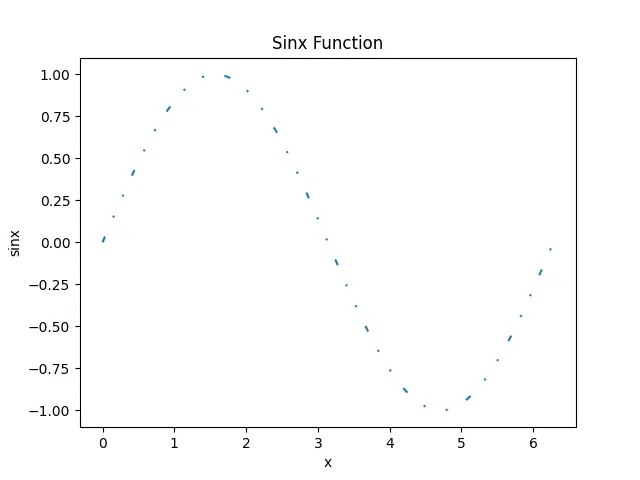
输出:

它使用 linestyles_dict 字典设置 linestyle。我们可以选择任何我们想要设置线型的键,并将该键的值传递给 linestyles_dict 字典,作为 plot() 方法中的 linestyle 参数。
作者: Suraj Joshi
Suraj Joshi is a backend software engineer at Matrice.ai.
LinkedIn