如何在 Matplotlib 中旋转 X 轴刻度标签文本
-
plt.xticks(rotation= )旋转 Xticks 标签文本 -
fig.autofmt_xdate(rotation= )旋转 Xticks 标签文本 -
ax.set_xticklabels(xlabels, rotation= )旋转 Xticks 标签文本 -
plt.setp(ax.get_xticklabels(), rotation=)旋转 Xticks 标签文本 -
ax.tick_params(axis='x', labelrotation= )旋转 Xticks 标签文本 -
旋转
xticklabels对齐

在本教程文章中,我们将介绍在 Python 标签中旋转 X 轴刻度标签文本的不同方法。这包括,
plt.xticks(rotation= )fig.autofmt_xdate(rotation= )ax.set_xticklabels(xlabels, rotation= )plt.setp(ax.get_xticklabels(), rotation=)ax.tick_params(axis='x', labelrotation= )
刻度标签文本在 X 轴上的默认方向是水平或 0 度。如果刻度标签文本过长(例如相邻标签文本之间重叠),则会带来不便。
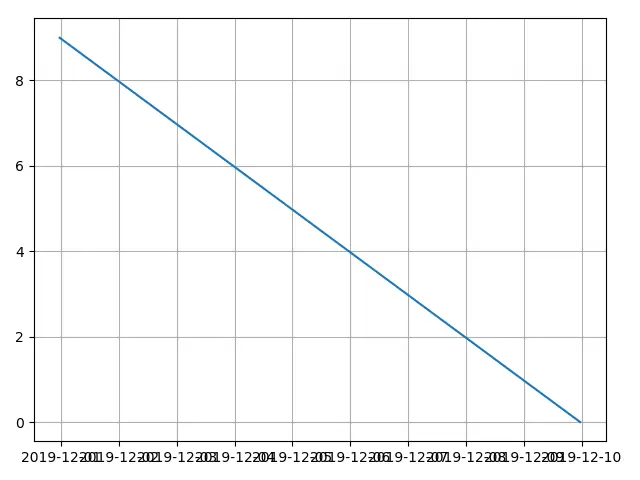
创建上图的代码是,
from matplotlib import pyplot as plt
from datetime import datetime, timedelta

values = range(10)
dates = [datetime.now() - timedelta(days=_) for _ in range(10)]

fig, ax = plt.subplots()
plt.plot(dates, values)
plt.grid(True)

plt.show()
plt.xticks(rotation= ) 旋转 Xticks 标签文本
from matplotlib import pyplot as plt
from datetime import datetime, timedelta

values = range(10)
dates = [datetime.now() - timedelta(days=_) for _ in range(10)]

fig, ax = plt.subplots()
plt.plot(dates, values)
plt.xticks(rotation=45)
plt.grid(True)

plt.show()
plt.xticks(rotation=45)
plt.xticks 获取或设置刻度位置和 x 轴标签的属性。
rotation 是 x 轴标签文本的逆时针旋转角度。
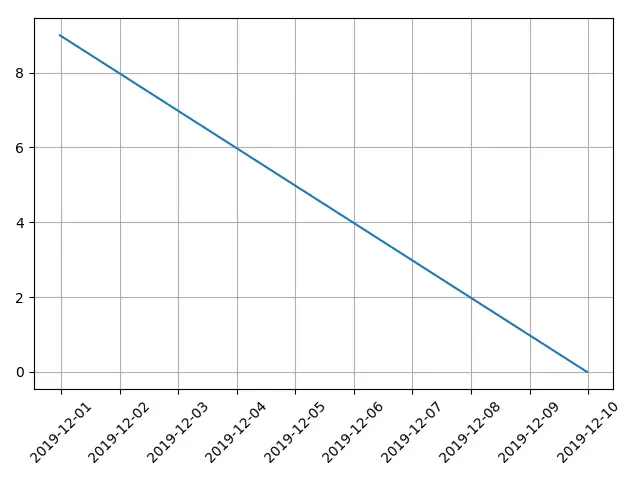
fig.autofmt_xdate(rotation= ) 旋转 Xticks 标签文本
from matplotlib import pyplot as plt
from datetime import datetime, timedelta

values = range(10)
dates = [datetime.now() - timedelta(days=_) for _ in range(10)]

fig, ax = plt.subplots()
plt.plot(dates, values)
fig.autofmt_xdate(rotation=45)
plt.grid(True)

plt.show()
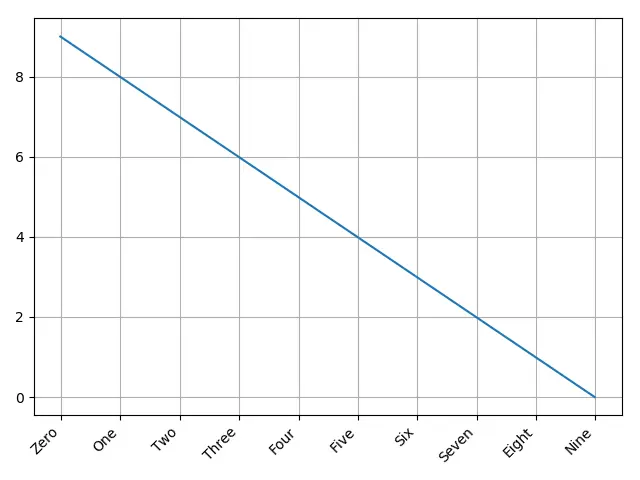
autofmt_xdate 旋转刻度线标签,如果标签是 date 对象,则自动将其右对齐。
但是它实际上不仅适用于 date 对象,而且适用于普通标签文本字符串。
from matplotlib import pyplot as plt
from datetime import datetime, timedelta

values = range(10)
dates = [datetime.now() - timedelta(days=_) for _ in range(10)]
xlabels = [
    "Zero",
    "One",
    "Two",
    "Three",
    "Four",
    "Five",
    "Six",
    "Seven",
    "Eight",
    "Nine",
]

fig, ax = plt.subplots()
plt.plot(dates, values)
ax.set_xticklabels(xlabels)
fig.autofmt_xdate(rotation=45)
plt.grid(True)

plt.show()
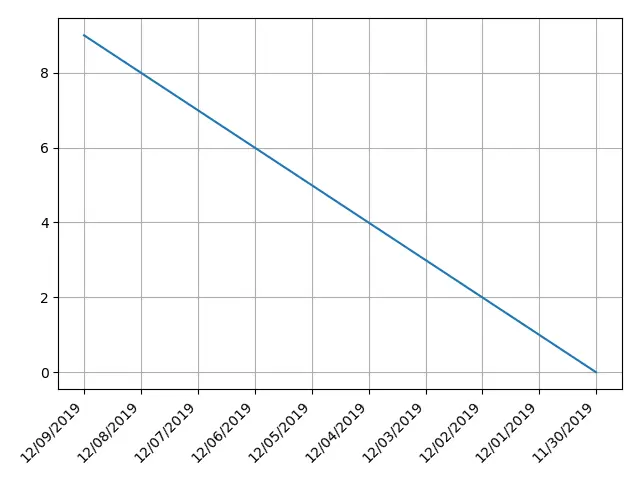
ax.set_xticklabels(xlabels, rotation= ) 旋转 Xticks 标签文本
set_xticklabels 设置带有字符串标签列表的 x-tick 标签。
字符串标签列表可以是新指定的列表,也可以是当前图的现有标签列表,由 get_xticklabels() 来读取。
from matplotlib import pyplot as plt
from datetime import datetime, timedelta

values = range(10)
dates = [datetime.now() - timedelta(days=_) for _ in range(10)]
xlabels = [
    datetime.strftime(datetime.now() - timedelta(days=_), "%m/%d/%Y") for _ in range(10)
]

fig, ax = plt.subplots()
plt.plot(dates, values)
ax.set_xticklabels(xlabels, rotation=45, ha="right")
plt.grid(True)

plt.show()
plt.setp(ax.get_xticklabels(), rotation=) 旋转 Xticks 标签文本
matplotlib.pyplot.setp 设置 artist 对象的属性。
plt.setp(ax.get_xticklabels(), rotation=) 设置 xtick 标签对象的 rotation 属性。
from matplotlib import pyplot as plt
from datetime import datetime, timedelta

values = range(10)
dates = [datetime.now() - timedelta(days=_) for _ in range(10)]
xlabels = [
    datetime.strftime(datetime.now() - timedelta(days=_), "%m/%d/%Y") for _ in range(10)
]

fig, ax = plt.subplots()
plt.plot(dates, values)
plt.setp(ax.get_xticklabels(), rotation=45, ha="right")
plt.grid(True)

plt.tight_layout()

plt.show()
ax.tick_params(axis='x', labelrotation= ) 旋转 Xticks 标签文本
tick_params 设置刻度线、刻度线标签和网格线的参数。
ax.tick_params(axis='x', labelrotation= ) 设置刻度标签在 x 轴上的 labelrotation 属性。
from matplotlib import pyplot as plt
from datetime import datetime, timedelta

values = range(10)
dates = [datetime.now() - timedelta(days=_) for _ in range(10)]
xlabels = [
    datetime.strftime(datetime.now() - timedelta(days=_), "%m/%d/%Y") for _ in range(10)
]

fig, ax = plt.subplots()
plt.plot(dates, values)

ax.tick_params(axis="x", labelrotation=45)
plt.grid(True)

plt.show()
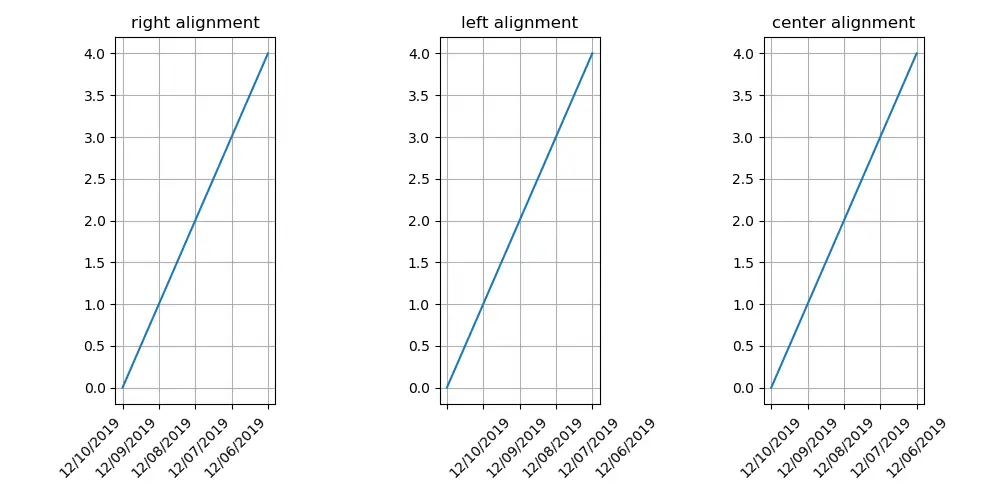
旋转 xticklabels 对齐
在上面的示例代码中,我们使用参数 ha='right',该的意思是ħ orizontal alignment 为 right。
ha='right' 将标签文本的右端与刻度对齐。
ha='left' 将标签文本的左端与刻度对齐。
ha='center' 使标签文本的中心与刻度线对齐。
from matplotlib import pyplot as plt
from datetime import datetime, timedelta

xvalues = range(5)
yvalues = xvalues
xlabels = [
    datetime.strftime(datetime.now() - timedelta(days=_), "%m/%d/%Y") for _ in xvalues
]

alignment = ["right", "left", "center"]
fig, axes = plt.subplots(1, 3)

for n, ax in enumerate(axes):
    ax.plot(xvalues, yvalues)
    ax.set_title(alignment[n] + "alignment")
    ax.set_xticks(xvalues)
    ax.set_xticklabels(xlabels, rotation=45, ha=alignment[n])
    ax.grid(True)

plt.show()

Founder of DelftStack.com. Jinku has worked in the robotics and automotive industries for over 8 years. He sharpened his coding skills when he needed to do the automatic testing, data collection from remote servers and report creation from the endurance test. He is from an electrical/electronics engineering background but has expanded his interest to embedded electronics, embedded programming and front-/back-end programming.
LinkedIn相关文章 - Matplotlib Axes
- 如何在 Matplotlib 中设置刻度标签 xticks 字体大小
- 如何在 Matplotlib 中的第二 Y 轴上添加 Y 轴标签
- 如何在 Matplotlib 中绘制对数轴
- 如何在 Matplotlib 中绘制等轴的正方形图
- 如何在 Matplotlib 中设置轴的范围