在 Matplotlib 中如何隐藏坐标轴文本刻度或刻度标签
-
xaxis.set_visible(False)/yaxis.set_visible(False)隐藏包括轴标签的坐标轴 -
xaxis.set_ticks([])/yaxis.set_ticks([])在 Matplotlib 中隐藏坐标轴 -
xaxis.set_ticklabels([])/yaxis.set_ticklabels([])在 Matplotlib 中隐藏轴标签/文本 -
xticks(color='w')/yticks(color='w')来隐藏 Matplotlib 中的坐标轴标签/文本
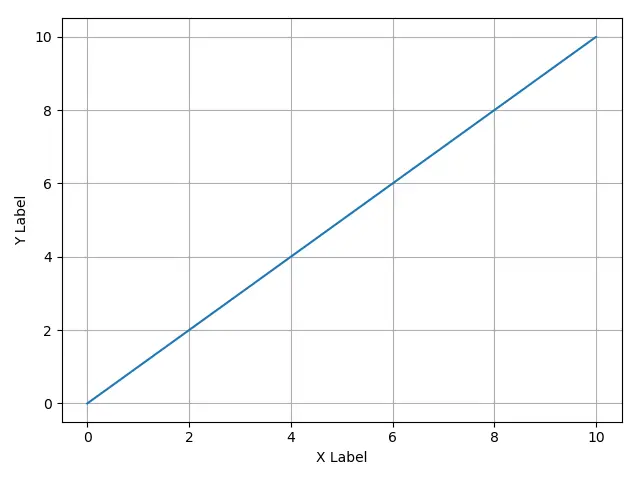
默认情况下,Matplotlib 中的图显示了两个轴的 ticks 和 ticklabels,如示例图所示。
它有不同的隐藏坐标轴文本的方法,例如 xaxis.set_visible(False),xaxis.set_ticks([]) 和 xaxis.set_ticklabels([])。如果将刻度线的颜色设置为白色,则仅当 Matplotlib 图形的前景色为白色时,它也可能使轴文本不可见。
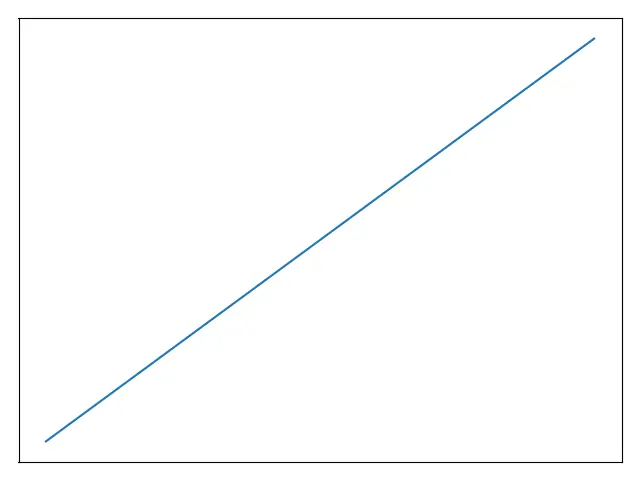
xaxis.set_visible(False)/yaxis.set_visible(False) 隐藏包括轴标签的坐标轴
顾名思义,它使整个坐标轴不可见,包括轴刻度,轴刻度标签和轴标签。
import matplotlib.pyplot as plt

plt.plot([0, 10], [0, 10])
plt.xlabel("X Label")
plt.ylabel("Y Label")

ax = plt.gca()
ax.axes.xaxis.set_visible(False)
ax.axes.yaxis.set_visible(False)

plt.grid(True)
plt.show()
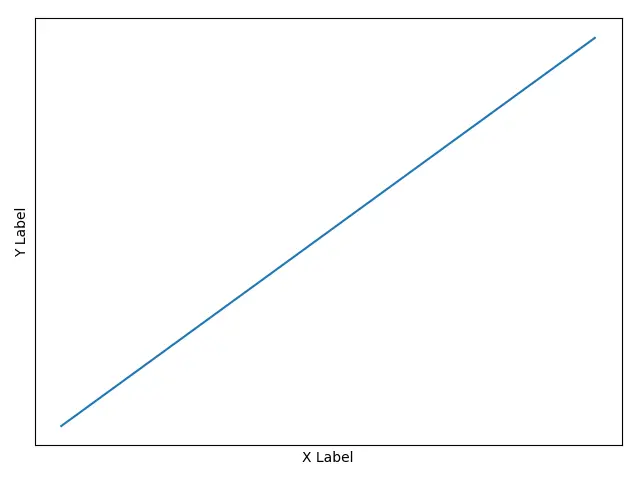
xaxis.set_ticks([])/yaxis.set_ticks([]) 在 Matplotlib 中隐藏坐标轴
x/yaxis.set_ticks([]) 设置刻度为空,并使坐标轴刻度及其标签不可见。但是坐标轴标签不受影响。
import matplotlib.pyplot as plt

plt.plot([0, 10], [0, 10])
plt.xlabel("X Label")
plt.ylabel("Y Label")

ax = plt.gca()
ax.axes.xaxis.set_ticks([])
ax.axes.yaxis.set_ticks([])

plt.grid(True)
plt.show()
xaxis.set_ticklabels([])/yaxis.set_ticklabels([]) 在 Matplotlib 中隐藏轴标签/文本
x/yaxis.set_ticklabels([]) 将刻度标签设置为空,从而使坐标轴文本(刻度标签)不可见,但刻度保持可见。
import matplotlib.pyplot as plt

plt.plot([0, 10], [0, 10])
plt.xlabel("X Label")
plt.ylabel("Y Label")

ax = plt.gca()

ax.axes.xaxis.set_ticklabels([])
ax.axes.yaxis.set_ticklabels([])

plt.grid(True)
plt.show()
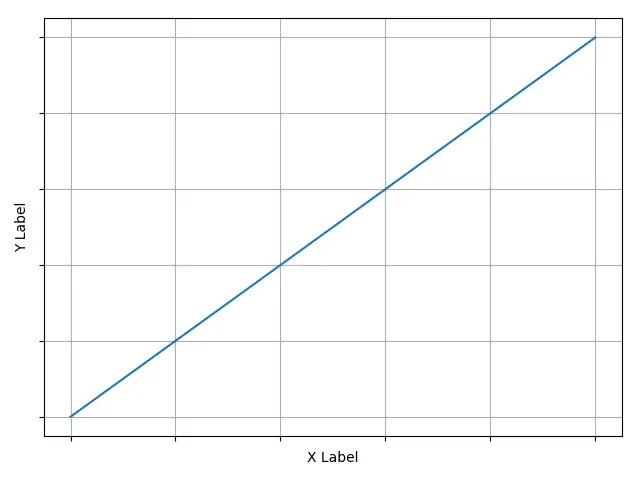
xticks(color='w')/yticks(color='w') 来隐藏 Matplotlib 中的坐标轴标签/文本
这种方法不会使刻度线标签或刻度线不可见,而是将刻度线的颜色设置为白色,以便在绘图的背景为白色(也是默认颜色)的情况下,轴文本的确是不可见的。
import matplotlib.pyplot as plt

plt.plot([0, 10], [0, 10])
plt.xlabel("X Label")
plt.ylabel("Y Label")

plt.xticks(color="w")
plt.yticks(color="w")

plt.grid(True)
plt.show()

Founder of DelftStack.com. Jinku has worked in the robotics and automotive industries for over 8 years. He sharpened his coding skills when he needed to do the automatic testing, data collection from remote servers and report creation from the endurance test. He is from an electrical/electronics engineering background but has expanded his interest to embedded electronics, embedded programming and front-/back-end programming.
LinkedIn