在 Matplotlib 中隐藏坐标轴、边框和空白
Suraj Joshi
2023年1月30日

本教程介绍了如何使用 matplotlib.pyplot.axis('off') 命令隐藏图中的轴,以及如何在保存图的同时删除图中的所有空白和边框。
隐藏 Matplotlib 图中的坐标轴
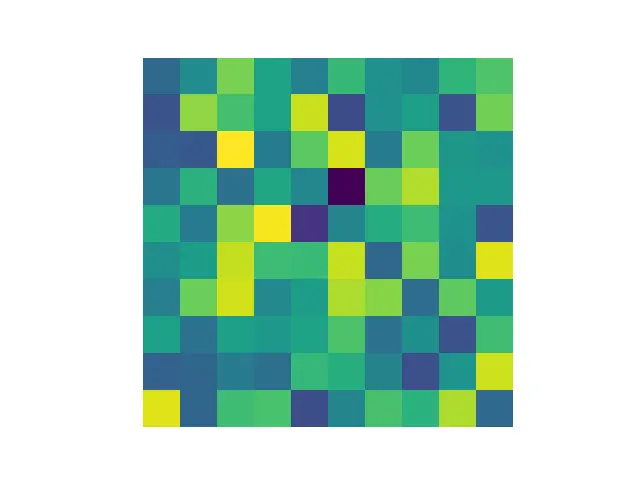
要隐藏坐标轴,我们可以使用命令 matplotlib.pyplot.axis('off')。
import numpy as np
import matplotlib.pyplot as plt

img = np.random.randn(10, 10)
plt.imshow(img)
plt.axis("off")

plt.show()
输出:

它同时隐藏了图中的 X 轴和 Y 轴。
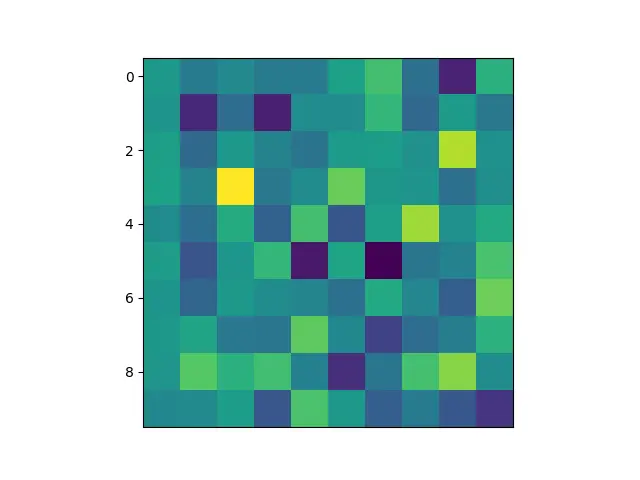
如果我们只想关闭 X 轴或 Y 轴,我们可以分别使用 axes.get_xaxis().set_visible() 或 axes.get_xaxis().set_visible() 方法。
import numpy as np
import matplotlib.pyplot as plt

img = np.random.randn(10, 10)

fig = plt.imshow(img)
ax = plt.gca()
ax.get_xaxis().set_visible(False)

plt.show()
输出:

它只隐藏了图中的 X 轴。
隐藏 Matplotlib 图中的空白和边框
plt.axis('off') 命令隐藏了坐标轴,但我们在保存图像时,在图像的边框周围得到了空白。为了消除边框周围的空白,我们可以在 savefig() 方法中设置 bbox_inches='tight'。同样的,为了去除图片周围的白色边框,我们在 savefig() 方法中设置 pad_inches=0。
import numpy as np
import matplotlib.pyplot as plt

img = np.random.randn(10, 10)

fig = plt.imshow(img)
plt.axis("off")
plt.savefig("image.png", bbox_inches="tight", pad_inches=0)
保存后的图片:

它使用 savefig() 方法保存没有任何坐标轴、边框和空白的图像。
我们也可以使用 matplotlib.pyplot.imsave() 方法保存没有任何轴、边框和空白的图像。
import numpy as np
import matplotlib.pyplot as plt

img = np.random.randn(100, 100)
plt.imsave("kapal.png", img)
作者: Suraj Joshi
Suraj Joshi is a backend software engineer at Matrice.ai.
LinkedIn