在 MATLAB 中绘制任何方程的指数函数
Mehak Mubarik
2024年2月15日

本教程将探讨在 MATLAB 中绘制任何方程的指数函数的不同方法。
在 MATLAB 中绘制任何方程的指数函数
我们将使用不同的示例代码和相关输出来清除你的概念,并让你全面了解在 MATLAB 中观察到的任何方程的指数函数的方法。
请注意,绘制指数函数以查看方程的上升和下降趋势或表达式。
任何指数函数都可以写成 g(x) = y(x),其中 y 是正数,g 表示指数表达式。如果我们看一下指数函数的定义,那么任何函数都有一个 e 常数,随着任何输入的功率增加。
指数函数包含实参数,我们函数的值与表达式的速率成正比。
在 MATLAB 中不使用任何预建函数绘制指数函数
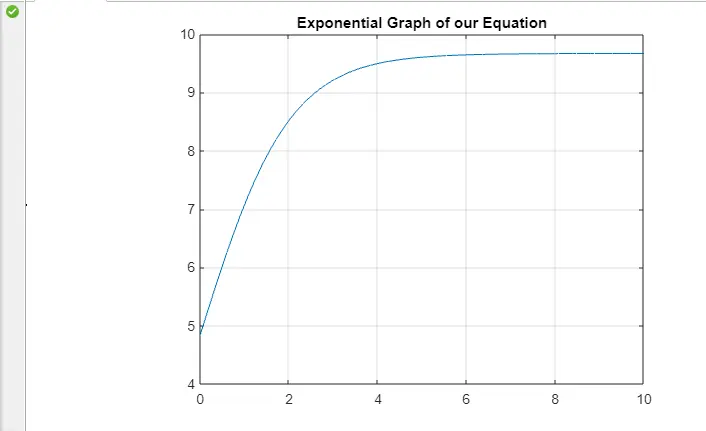
让我们通过以下示例来理解这个概念。我们将首先绘制一个指数函数而不使用任何函数。
之后,我们将查看使用 MATLAB 函数绘制指数函数的不同示例。
代码:
A = linspace(0, 10);
B = 58./(6+6*exp(-A));
figure(1)
plot(A, B)
grid
title ('Exponential Graph of our Equation')
输出:

在 MATLAB 中使用 exp() 函数绘制指数函数
MATLAB 允许其用户使用各种预构建的 MATLAB 函数和命令。MATLAB 提供了函数 exp(),我们在其中传递一个指数函数作为参数来绘制指数函数。
我们可以使用 plot() 函数以图形方式显示它们。
让我们通过查看以下示例来理解这个概念。
代码:
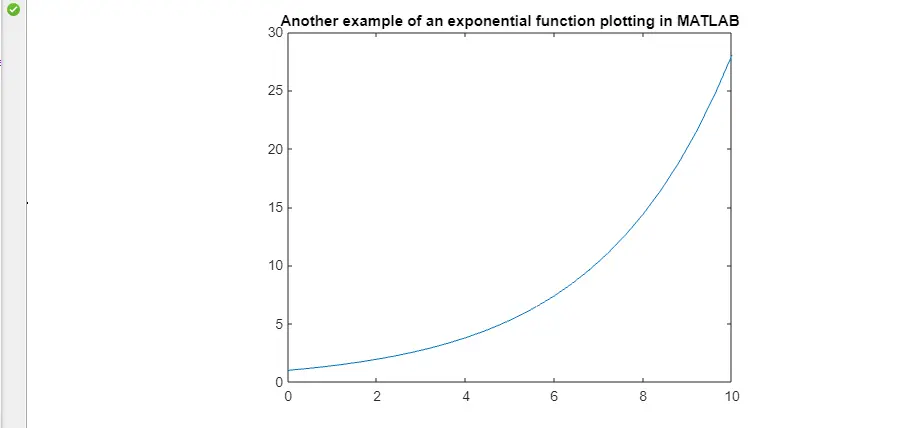
A = 0:0.4:10;
B = exp(A/3);
plot(A,B)
title('Another example of an exponential function plotting in MATLAB')
输出:

让我们看另一个例子。
代码:
f = @(t,y) 3*y+2-5*t;
t = 0:0.15:0.8;
y = -2.5:0.06:-1.5;
hold on
t = linspace(0,10,90);
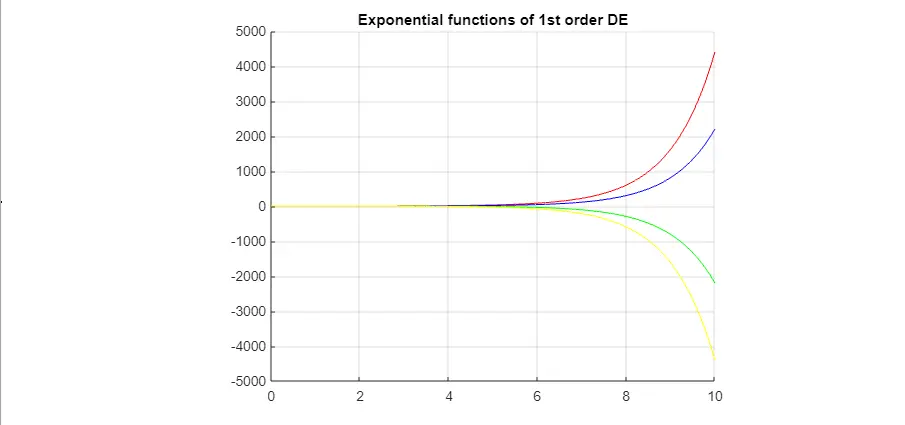
y1 = (3*exp(-2*t)-4.*exp(-3*t)+0.2)./(1*exp(-1*t));
y2 = (3*exp(-2*t)-4.*exp(-3*t)+0.1)./(1*exp(-1*t));
y3 = (3*exp(-2*t)-4.*exp(-3*t)-0.1)./(1*exp(-1*t));
y4 = (3*exp(-2*t)-4.*exp(-3*t)-0.2)./(1*exp(-1*t));
plot(t,y1,'r',t,y2,'b',t,y3,'g',t,y4,'y')
title('Exponential functions of 1st order DE')
hold off
输出:

作者: Mehak Mubarik
Mehak is an electrical engineer, a technical content writer, a team collaborator and a digital marketing enthusiast. She loves sketching and playing table tennis. Nature is what attracts her the most.
LinkedIn