在 MATLAB 中绘制方程
Ammar Ali
2024年2月15日

在本教程中,我们将讨论如何通过声明方程中存在的自变量的值来绘制方程,然后使用 plot() 函数绘制它,以及如何使用 ezplot() 绘制方程。MATLAB。
在 MATLAB 中使用 plot() 函数绘制方程
假设你想在 MATLAB 中绘制一个方程,该方程具有一个因变量和一个或多个自变量。要绘制方程,你需要声明方程中存在的自变量,然后你可以找到因变量的值,使用这些值你可以使用 plot() 函数绘制方程。例如,让我们绘制一个具有一个因变量和一个自变量的方程。请参考下面的代码。
a = -5:0.01:5;
b = cos(a).^2+cos(a).^3;
plot(a,b)
输出:
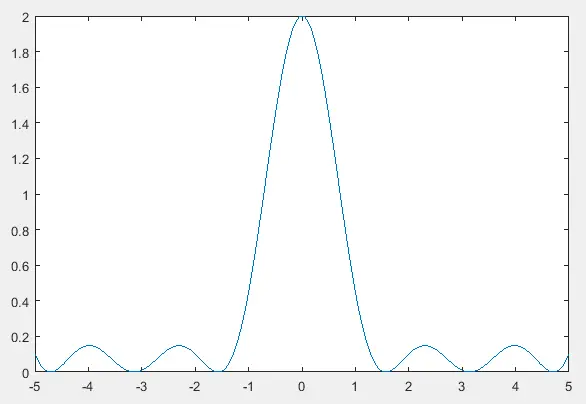
在上面的代码中,我们声明了一个自变量的随机值来计算因变量的值,你可以根据需要更改自变量的值。你还可以根据你的方程增加自变量的数量。
在 MATLAB 中使用 ezplot() 函数绘制方程
假设你想在 MATLAB 中绘制一个方程,该方程具有一个因变量和一个或多个自变量。要使用 ezplot() 绘制方程,首先,你需要使用@() 函数将方程定义为函数,然后,你需要在@() 函数内传递自变量。最后,你可以使用 ezplot() 函数绘制方程。例如,让我们绘制一个具有一个因变量和一个自变量的方程。请参考下面的代码。
f = @(a) cos(a).^2+cos(a).^3;
ezplot(f)
输出:
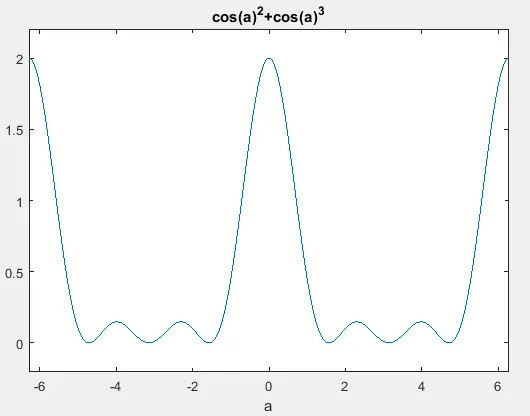
在上面的代码中,我们将方程声明为函数 f,正如你所看到的,输出与上面的输出相同,只是独立变量值有所不同。ezplot() 函数自动为自变量赋值。你还可以根据你的方程增加自变量的数量。
作者: Ammar Ali
