MATLAB RGB 三元组
Ammar Ali
2024年2月15日

在本教程中,我们将讨论如何在 MATLAB 中使用 RGB 颜色设置图的颜色。
在 MATLAB 中使用 RGB 颜色设置图的颜色
在 RGB 中,共有三种主要颜色:红色、绿色和蓝色,其值范围为 0 到 1。在 MATLAB 中,你可以使用 RGB 颜色值定义绘图颜色。要使用 RGB 颜色,必须在绘图功能中使用属性 Color,然后在该属性之后,可以在矢量中添加 RGB 三元组的任何值。例如,让我们将 RGB 颜色添加到一行。请参见下面的代码。
l = 1:100;
plot(l,l,'Color',[.1 .1 .9],'LineWidth',10)
hold on
plot(2*l,l,'Color',[.1 1 .1],'LineWidth',10)
plot(3*l,l,'Color',[1 .1 .1],'LineWidth',10)
输出:
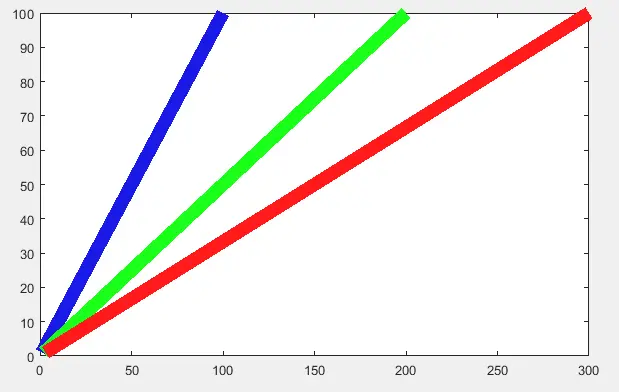
在上面的代码中,我们绘制了三行具有不同 RGB 颜色的线。你可以根据需要在 0 到 1 之间设置颜色值。
作者: Ammar Ali
