在 Matlab 中创建新图形
Ammar Ali
2024年2月15日

在本教程中,我们将讨论如何使用 MATLAB 中的 figure() 函数创建一个新图形。
使用 MATLAB 中的 figure() 函数创建一个新图窗
如果要在多个图形上绘制数据,可以使用 figure() 函数创建一个新图形并在那里绘制数据。要使用 figure() 绘制多个图形,你只需在此函数中定义图形的编号。例如,让我们在两个不同的图形上绘制两个变量。请参考下面的代码。
t = 1:0.01:10;
x1 = sin(2*pi*t);
x2 = sin(2*pi*t - 10);
figure(1)
plot(t,x1,'Color','r')
figure(2)
plot(t,x2,'Color','g')
输出:
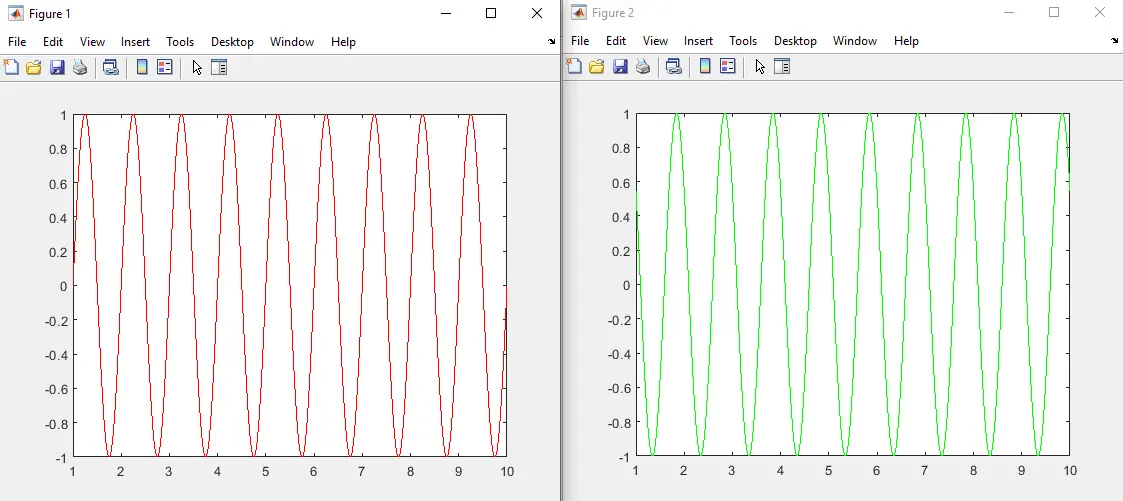
在上面的代码中,我们在图 1 中绘制了一个红色的正弦波,在图 2 中绘制了一个绿色的正弦波。figure() 下的每个 plot() 函数都会在同一个图形上绘制数据。如果要在新图形上绘图,则必须使用 figure() 函数创建它。你还可以使用 Name 属性为图形命名。你可以使用 Position 属性更改图形的位置,也可以使用 Units 属性更改图形的单位。查看此链接以获取有关 figure() 函数的更多详细信息。
作者: Ammar Ali
