Matplotlib 教程 - 折線圖

我們從繪製基本圖表型別 - 折線圖開始。plot 可以輕鬆繪製出直線或曲線之類的線,並具有不同的配置,例如顏色、寬度和標記大小等。
Matplotlib 繪製直線
# -*- coding: utf-8 -*-
import numpy as np
import matplotlib.pyplot as plt

x = np.linspace(0, 9, 10)
y = 2 * x
plt.plot(x, y, "b-")
plt.show()
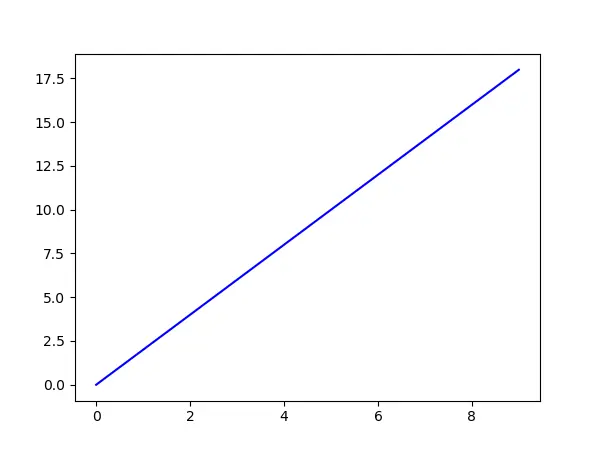
它繪製 y=2*x 的直線,其中 x 是在 0 到 9 之間的範圍內。
plt.plot(x, y, "b-")
它繪製的 x 和 y 的資料採用線條樣式 b -藍色以及 - -實線。
Matplotlib 繪製曲線
# -*- coding: utf-8 -*-
import numpy as np
import matplotlib.pyplot as plt

x = np.linspace(0, 4 * np.pi, 1000)
y = np.sin(x)

plt.plot(x, y, "r--")

plt.show()
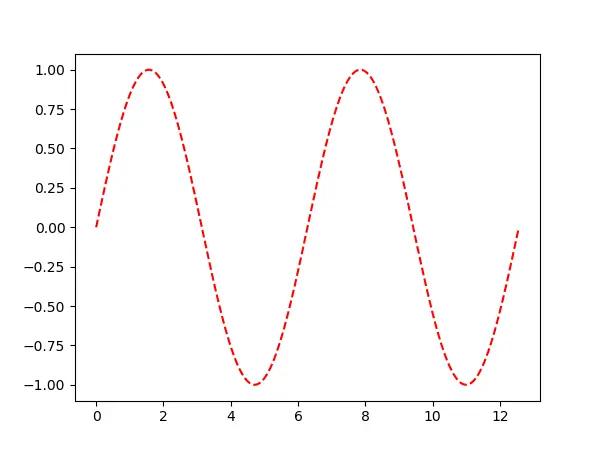
它會繪製一個正弦波形,其線型為紅色 r 和虛線 --。
線型
你可以在 plt.plot() 函式中使用不同的輸入引數來更改線條型別,例如寬度、顏色和線條樣式。
matplotlib.pyplot.plot(*args, **kwargs)
引數
| 名稱 | 描述 |
|---|---|
x, y |
資料點的水平/垂直座標 |
fmt |
格式字串,例如’b-‘表示藍色實線 |
**kwargs
| 屬性 | 描述 |
|---|---|
color 或 c |
任何 matplotlib 顏色 |
figure |
Figure 例項 |
label |
物件 |
linestyle 或 ls |
[‘solid’ | ‘dashed’, ‘dashdot’, ‘dotted’ | (offset, on-off-dash-seq) | '-'] |
linewidth 或 lw |
線寬,以 points 為單位 |
marker |
有效的 marker 格式 |
markersize 或 ms |
float 型別 |
xdata |
一維陣列 |
ydata |
一維陣列 |
zorder |
float 型別 |
線的顏色
Matplotlib 中有不同的方法可以在 color 引數中命名顏色。
單字母別名
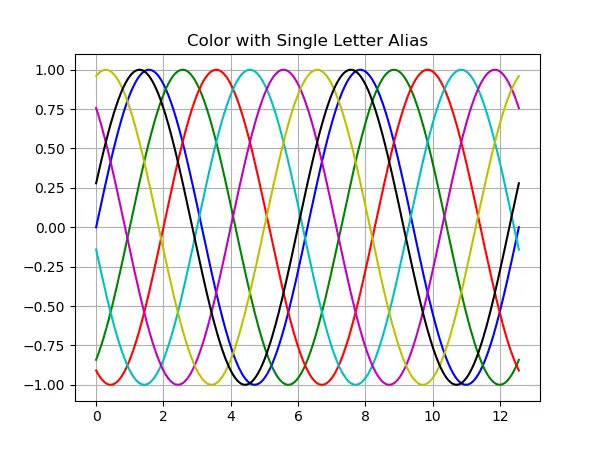
基本的內建顏色具有以下別名:
| 別名 | 顏色 |
|---|---|
b |
藍色 |
g |
綠色 |
r |
紅色 |
c |
青色 |
m |
品紅 |
y |
黃色 |
k |
黑色 |
w |
白色 |
HTML 十六進位制字串
你可以將有效的 html 十六進位制字串傳遞給 color 引數,例如
color = "#f44265"
RGB 元組
你也可以使用 R,G,B 元組指定顏色,其中 R,G,B 值在 [0, 1] 的範圍內,而不是在正常的範圍 [0, 255] 內。
上面的 html 十六進位制字串表示的顏色的 RGB 值為 (0.9569, 0.2588, 0.3891)。
color = (0.9569, 0.2588, 0.3891)
線型
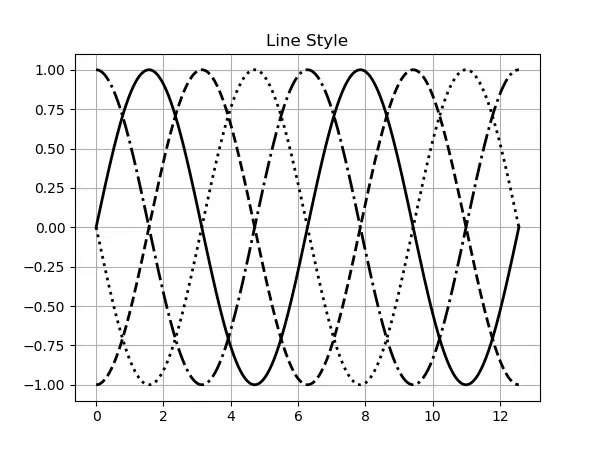
Matplotlib 具有 4 種內建線型,
| 線型 | |
|---|---|
- |
 |
-- |
 |
: |
 |
:- |
 |
# -*- coding: utf-8 -*-
import numpy as np
import matplotlib.pyplot as plt

x = np.linspace(0, 4 * np.pi, 1000)

for index, line_style in enumerate(["-", "--", ":", "-."]):
    y = np.sin(x - index * np.pi / 2)
    plt.plot(x, y, "k", linestyle=line_style, lw=2)

plt.title("Line Style")
plt.grid(True)

plt.show()
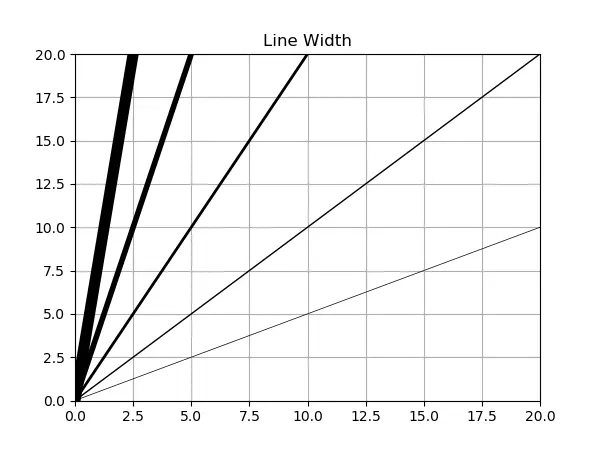
線寬
你可以使用引數指定線寬 linewidth,如下所示:
linewidth = 2 # unit is points
或只是使用其縮寫,
lw = 2
# -*- coding: utf-8 -*-
import numpy as np
import matplotlib.pyplot as plt

x = np.linspace(0, 20, 21)

for line_width in [0.5, 1, 2, 4, 8]:
    y = line_width * x
    plt.plot(x, y, "k", linewidth=line_width)

plt.title("Line Width")
plt.grid(True)

plt.show()
Founder of DelftStack.com. Jinku has worked in the robotics and automotive industries for over 8 years. He sharpened his coding skills when he needed to do the automatic testing, data collection from remote servers and report creation from the endurance test. He is from an electrical/electronics engineering background but has expanded his interest to embedded electronics, embedded programming and front-/back-end programming.
LinkedIn