Matplotlib 教程 - 簡介和安裝

Matplotlib 是使用最廣泛的 Python 模組來繪製圖形。它可以輕鬆生成可隨時釋出的資料,並可以在不同的平臺上使用。
pyplot Matplotlib 的模組具有類似於 MATLAB 的介面,因此 pyplot 如果你已經是 MATLAB 的使用者,則使用起來會更容易。
安裝 Matplotlib
視窗
-- pip
pip install matplotlib
此 pip 命令還會自動安裝 Matplotlib 依賴項。
-安裝車輪檔案
你還可以從著名的非官方 Windows Binary for Python Extension Packages 網站下載 Python 2.7 或 Python 3.4+ 版本的非官方預構建 32 或 64 位 Windows Matplotlib 輪檔案。
下載 wheel 檔案後,使用以下命令安裝 wheel 檔案。
pip install matplot_wheel_file_path
的 Linux
開啟 Linux 終端,並根據系統中的 Python 版本使用以下命令。
Python 2.7
sudo apt-get install python-matplotlib
Python 3.4 以上
sudo apt-get instlal python3-matplotlib
MatplotlibHello World
現在,我們將第一口 Matplotlib。
from matplotlib import pyplot as plt
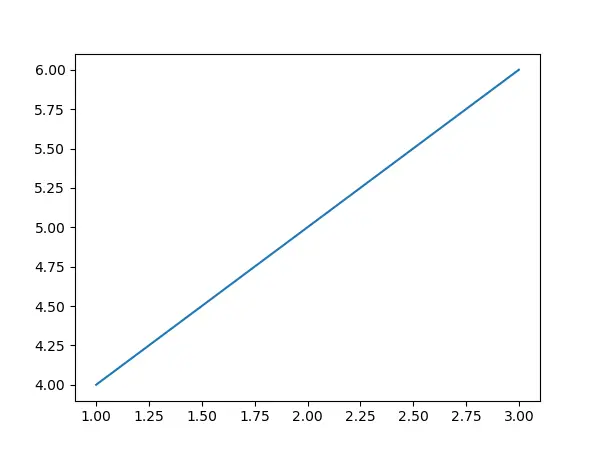
plt.plot([1, 2, 3], [4, 5, 6])
plt.show()
本示例繪製了具有 2-D 資料-的直線的圖形 [1,2,3],[4,5,6]。
from matplotlib import pyplot as plt
如上所述,它 pyplot 是一個類似於 MATLAB 的繪圖模組。
plt.plot([1, 2, 3], [4, 5, 6])
由於未在此處傳遞任何額外的引數,因此它會繪製 x 和 y 使用預設的線條和顏色樣式。
plt.show()
它顯示該圖。執行此行之前,不會顯示繪圖圖。

Founder of DelftStack.com. Jinku has worked in the robotics and automotive industries for over 8 years. He sharpened his coding skills when he needed to do the automatic testing, data collection from remote servers and report creation from the endurance test. He is from an electrical/electronics engineering background but has expanded his interest to embedded electronics, embedded programming and front-/back-end programming.
LinkedIn