Python 中的 Seaborn tsplot()
Manav Narula
2024年2月15日

在本教程中,我們將學習如何在 Seaborn 中使用 seaborn.tsplot() 函式。
seaborn.tsplot() 是一個非常強大和有用的函式。當我們有可用資料的時間戳時使用它。它用於繪製一個或多個時間序列資料。資料可以是長資料幀的形式,也可以是具有單位和時間維度的 N 維陣列。
此功能還可以輕鬆高效地繪製多個時間序列資料。我們可以使用各種引數(例如 unit、condition 等)自定義最終繪圖。unit 引數可以是一個 series 或 DataFrame 列,用於標識取樣單元,condition 引數可以標識資料的條件或其類別。
我們可以使用 color、linewidth 引數更改最後一行,使繪圖在視覺上更具吸引力。
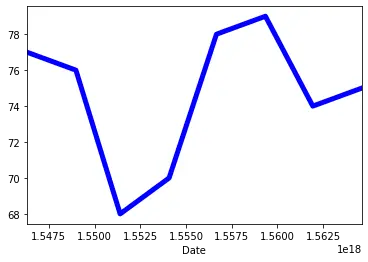
在以下程式碼中,我們將使用此函式繪製圖形。
import pandas as pd
import matplotlib.pyplot as plt
import seaborn as sns

df = pd.DataFrame(
    {
        "Date": [
            "01012019",
            "01022019",
            "01032019",
            "01042019",
            "01052019",
            "01062019",
            "01072019",
            "01082019",
        ],
        "Price 1": [77, 76, 68, 70, 78, 79, 74, 75],
    }
)
df["Date"] = pd.to_datetime(df["Date"], format="%d%m%Y")

sns.tsplot(data=df["Price 1"], time=df["Date"], color="blue", linewidth=5)
值得一提的是,雖然該功能對於繪製時間序列資料非常強大,但它在 2020 年 1 月版本的 seaborn 模組中已被棄用。建議使用 seaborn.lineplot() 函式作為替代。
作者: Manav Narula

Manav is a IT Professional who has a lot of experience as a core developer in many live projects. He is an avid learner who enjoys learning new things and sharing his findings whenever possible.
LinkedIn