將透明矩形新增到 R 中的 Boxplot
本文將演示有關如何在 R 中向箱線圖新增透明矩形的多種方法。
使用 rect 函式將透明矩形新增到 R 中的箱線圖
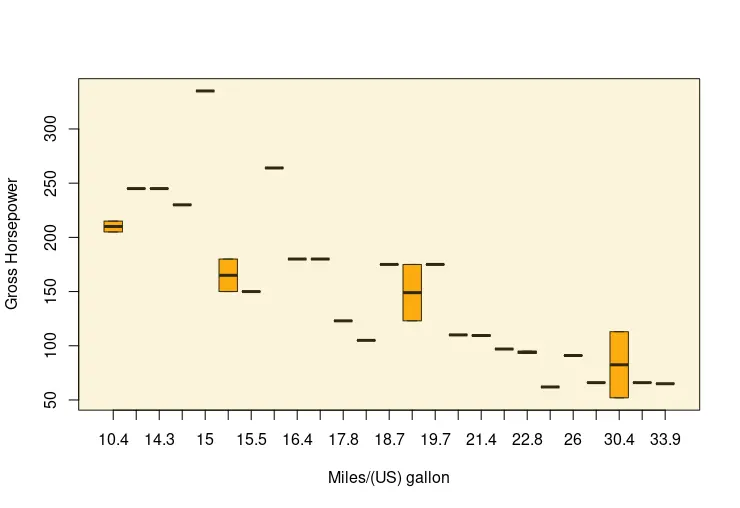
可以繪製一個透明矩形作為現有圖形的疊加,使用 boxplot 函式構建。rect 函式在 plot 函式之後呼叫以繪製矩形。請注意,rect 也可用於繪製具有給定座標的矩形序列。在這種情況下,我們只向作為背景疊加的箱線圖中新增一個矩形。rect 函式將位置作為前四個引數,用於指定矩形區域。這四個引數可以作為標量值或標量向量傳遞。以下示例採用 mtcars 資料集及其兩個數字列來繪製比例尺。由於這些值是數字,我們可以使用 max 函式來指定一些位置。rect 函式還可以將顏色作為引數來填充矩形。這一次,rgb 函式用於傳遞顏色值和代表其不透明度的 alpha 引數。
boxplot(hp ~ mpg, data = mtcars,
       xlab = "Miles/(US) gallon", ylab = "Gross Horsepower",
       col = "orange")

rect(-1, -1, max(mtcars$hp + 100), max(mtcars$hp) + 100,
     col= rgb(red = 0.95, green = 0.8, blue = 0.3, alpha = 0.2))
使用 annotate 函式和 ggplot 將透明矩形新增到 R 中的 Boxplot
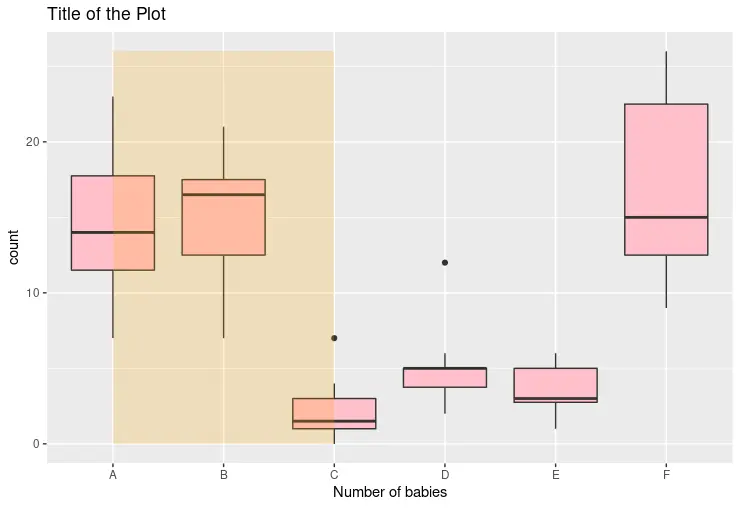
如果繪圖是使用 ggplot 庫構建的,我們可以使用 annotate 函式新增一個透明矩形。以下程式碼片段在 x 軸上顯示帶有字元值的箱線圖。annotate 函式將 rect 字串作為第一個引數來指定註釋層的矩形形狀。以下四個引數指定形狀的位置值。即使 x 軸具有非數字值,該函式也可以列舉它們的位置並擬合使用者傳遞的位置編號。
library(ggplot2)
library(dplyr)

p1 <- ggplot(InsectSprays, aes(x = spray, y = count)) +
  geom_boxplot(fill = "pink") +
  scale_x_discrete(name = "Number of babies") +
  ggtitle("Title of the Plot") +
  annotate("rect", xmin = 1, xmax = 3, ymin = 0, ymax = max(InsectSprays$count),
           alpha = .2, fill = "orange")

p1
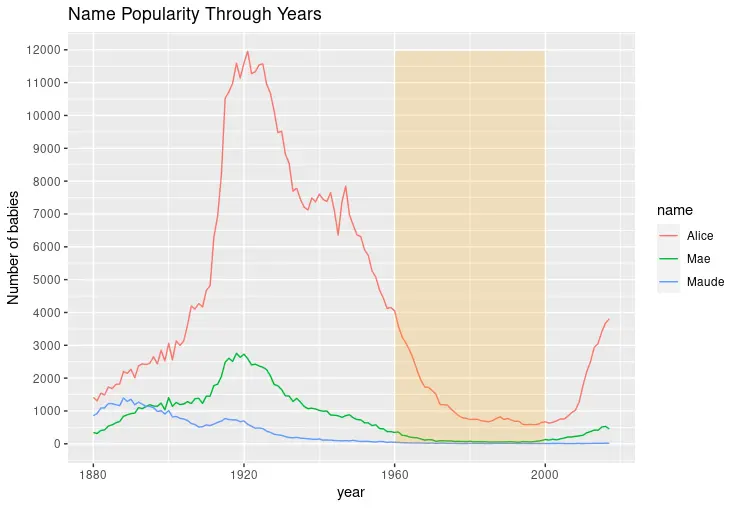
或者,可以使用 annotate 函式在折線圖上繪製一個矩形並突出顯示繪圖的特定範圍。請注意,當比例具有數值時,*min/*max 引數可以從這些範圍中獲取精確值。
library(ggplot2)
library(babynames)
library(dplyr)
dat <- babynames %>%
filter(name %in% c("Alice", "Maude", "Mae")) %>%
filter(sex=="F")
p1 <- ggplot(dat, aes(x = year, y = n, color = name)) +
geom_line() +
scale_y_continuous(
breaks = seq(0, 15000, 1000),
name = "Number of babies") +
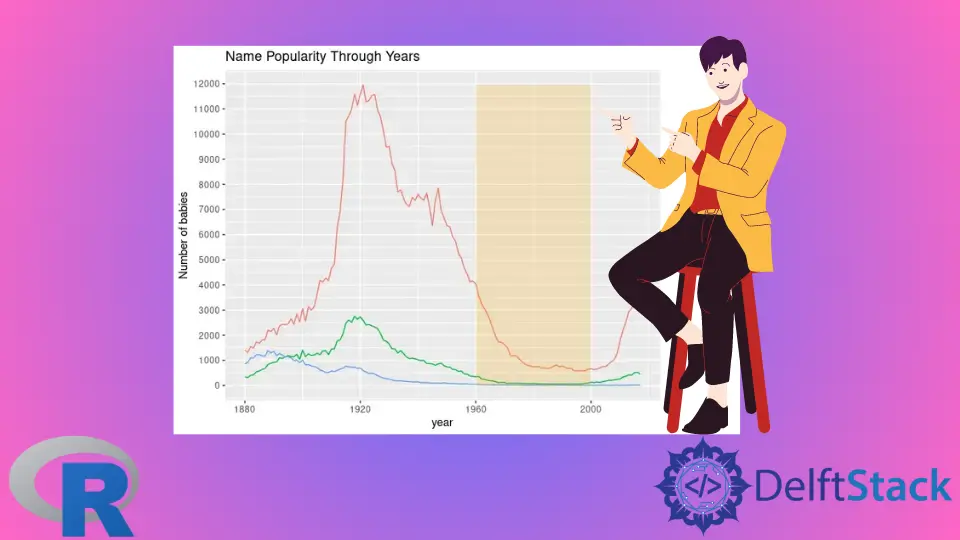
ggtitle("Name Popularity Through Years") +
annotate("rect", xmin = 1960, xmax = 2000, ymin = -1, ymax = max(dat$n),
alpha = .2, fill = "orange")
p1

Founder of DelftStack.com. Jinku has worked in the robotics and automotive industries for over 8 years. He sharpened his coding skills when he needed to do the automatic testing, data collection from remote servers and report creation from the endurance test. He is from an electrical/electronics engineering background but has expanded his interest to embedded electronics, embedded programming and front-/back-end programming.
LinkedIn