在 R 中建立並排箱線圖

本文將介紹在 R 中建立並排箱線圖的方法。
在 R 中使用 par 函式建立並排箱線圖
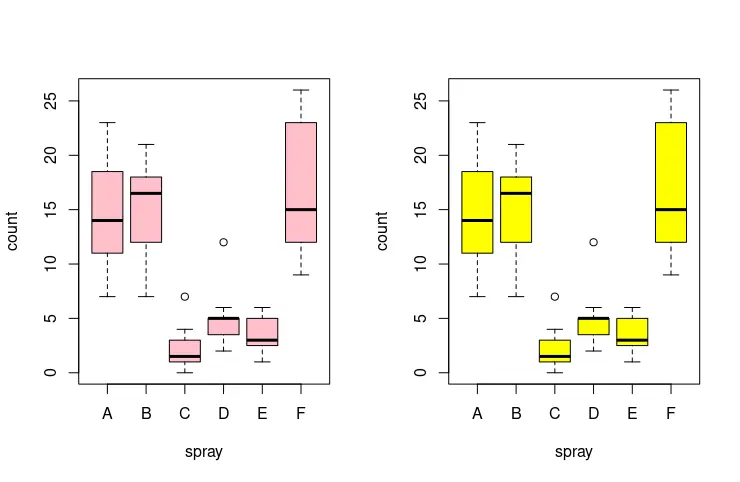
par 功能可用於設定圖形引數。呼叫不帶引數或 no.readonly = TRUE 的函式會檢索所有圖形引數。在這種情況下,我們使用 mfrow 引數來構建並排箱線圖。mfrow 在 c(nr, nc) 向量中傳遞,隨後的圖繪製為 nr-by-nc 陣列。以下示例程式碼從 InsectSprays 資料集構建了兩個箱線圖,其中相應地繪製了 count 和 spray 列。儘管對 boxplot 函式的深入審查超出了本文的範圍,但它需要 col 引數來指定盒體的顏色。請注意,最後一個 par(mfrow=c(1,1)) 函式呼叫用於將佈局重置為預設設定。
par(mfrow=c(1,2))
boxplot(count ~ spray, data = InsectSprays, col = "pink")
boxplot(count ~ spray, data = InsectSprays, col = "yellow")
par(mfrow=c(1,1))
在 R 中使用 grid.arrange 函式建立並排箱線圖
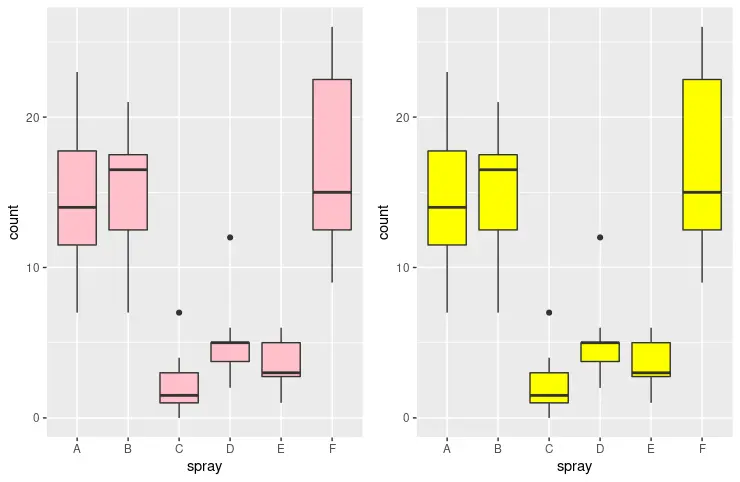
或者,我們可以使用 gridExtra 包中的 grid.arrange 函式。grid.arrange 的行為類似於 par 函式。儘管如此,它對於多個繪圖更加靈活和直觀,尤其是 ggplot 物件。grid.arrange 將可變長度的 ggplot 物件作為起始引數。之後,我們可以指定可選引數,即表示需要為繪圖建立的列數的 ncol 引數。下一個程式碼片段繪製兩個並排的箱線圖。
library(ggplot2)
library(gridExtra)

plot1 <- ggplot(InsectSprays, aes(x = spray, y = count)) + geom_boxplot(fill = "pink")
plot2 <- ggplot(InsectSprays, aes(x = spray, y = count)) + geom_boxplot(fill = "yellow")
grid.arrange(plot1, plot2, ncol = 2)
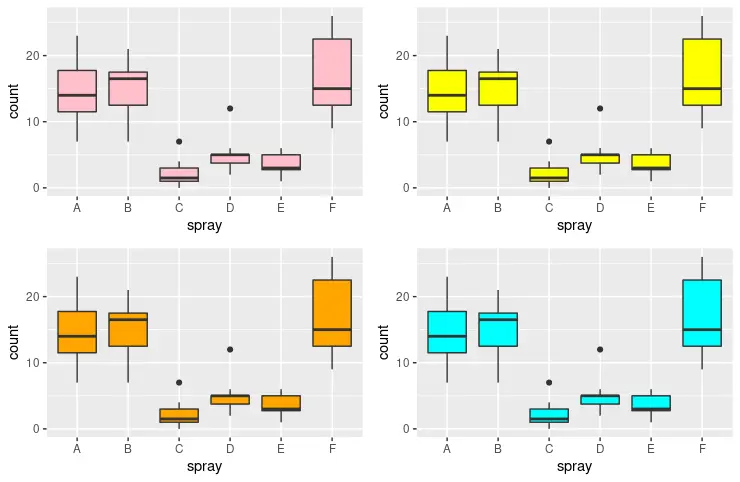
grid.arrange 還可以建立使用 nrow 和 ncol 引數指定的二維拆分視窗。請注意,ggplot 物件可以組合成一個列表,並以 grobs = list(...) 引數的形式傳遞。以下示例以 2×2 矩陣樣式輸出四個箱線圖。
library(ggplot2)
library(gridExtra)

plot1 <- ggplot(InsectSprays, aes(x = spray, y = count)) + geom_boxplot(fill = "pink")
plot2 <- ggplot(InsectSprays, aes(x = spray, y = count)) + geom_boxplot(fill = "yellow")
plot3 <- ggplot(InsectSprays, aes(x = spray, y = count)) + geom_boxplot(fill = "orange")
plot4 <- ggplot(InsectSprays, aes(x = spray, y = count)) + geom_boxplot(fill = "cyan")
grid.arrange(plot1, plot2, plot3, plot4, nrow = 2, ncol = 2)
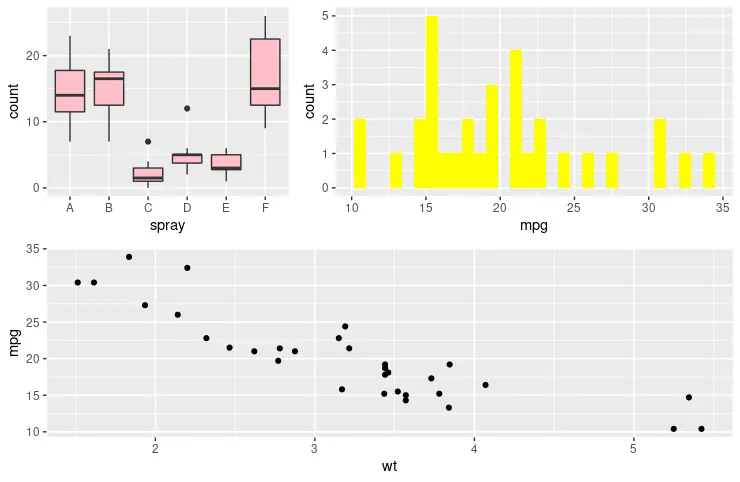
grid.arrange 函式的另一個有用引數是 layout_matrix,它將每個圖定位在由組合向量指定的自定義結構中。該示例定義了以非對稱視窗結構構建的三個不同繪圖物件 - 頂部兩個繪圖和一個下方繪圖。rbind 中向量的數量對應於視窗行,每個物件中的元素指定給定視窗行應該分成的部分數。同時,數字對應於相同順序的引數圖。如果第二行上的所有拆分視窗都應被第三個圖佔據,則第二個向量中的所有元素都應具有值 - 3。
library(ggplot2)
library(gridExtra)

plot1 <- ggplot(InsectSprays, aes(x = spray, y = count)) + geom_boxplot(fill = "pink")
plot2 <- ggplot(mtcars, aes(x = mpg)) + geom_histogram(fill = "yellow", bins = 30)
plot3 <- ggplot(mtcars, aes(x = wt, y = mpg)) + geom_point(fill = "orange")

grid.arrange(plot1, plot2, plot3, widths = c(2, 2, 1),
    layout_matrix = rbind(c(1, 2, 2), c(3, 3, 3)))

Founder of DelftStack.com. Jinku has worked in the robotics and automotive industries for over 8 years. He sharpened his coding skills when he needed to do the automatic testing, data collection from remote servers and report creation from the endurance test. He is from an electrical/electronics engineering background but has expanded his interest to embedded electronics, embedded programming and front-/back-end programming.
LinkedIn