在 R 中建立 3D 透檢視
Jesse John
2023年1月30日

我們可以使用基礎 R 的 persp() 函式建立曲面的透檢視。曲面通過與所有 (x,y) 值對相對應的 z 值。
要使用 persp() 函式,我們需要了解其主要引數的格式。本文的其餘部分通過簡單的示例演示和解釋這些。
R 中 persp() 函式的引數
由於 persp() 在 3 維中繪圖,因此 3 個座標有三個引數 x、y 和 z。
-
x和y是數值向量。這些必須按升序排列。 -
引數
z採用矩陣。該矩陣中必須有一個z值對應於x和y的每個組合。繪製的曲面通過所有
z值。
建立 z 矩陣的一種方法是使用 outer() 函式將二元函式應用於 x 和 y 值的所有組合。
預設情況下,persp() 函式從 y 軸的負側顯示檢視。
phi引數給出了 colatitude。將phi從 0 度更改為 90 度會影響將檢視從前面更改為頂部。theta引數給出方位角。將theta從 0 度更改為 90 度具有使圖形繞其垂直軸順時針旋轉的效果。
R 中的平面圖
我們現在將建立兩個平面並從不同的角度檢視它們。第一個是水平面。
示例程式碼:
# A function that gives a constant z value.
H = function(x, y){
  return (0*x+0*y+1)
}

X = seq(-1,1,length.out=5)
Y = seq(-1,1, length.out=5)

# Apply the H function to all pairs (x,y).
# This gives the z matrix.
Z = outer(X, Y, H)

# Four different views.
persp(x=X,y=Y,z=Z, theta=0, phi=0, xlim=range(-2,2), ylim=range(-2,2), zlim=range(-2,2))
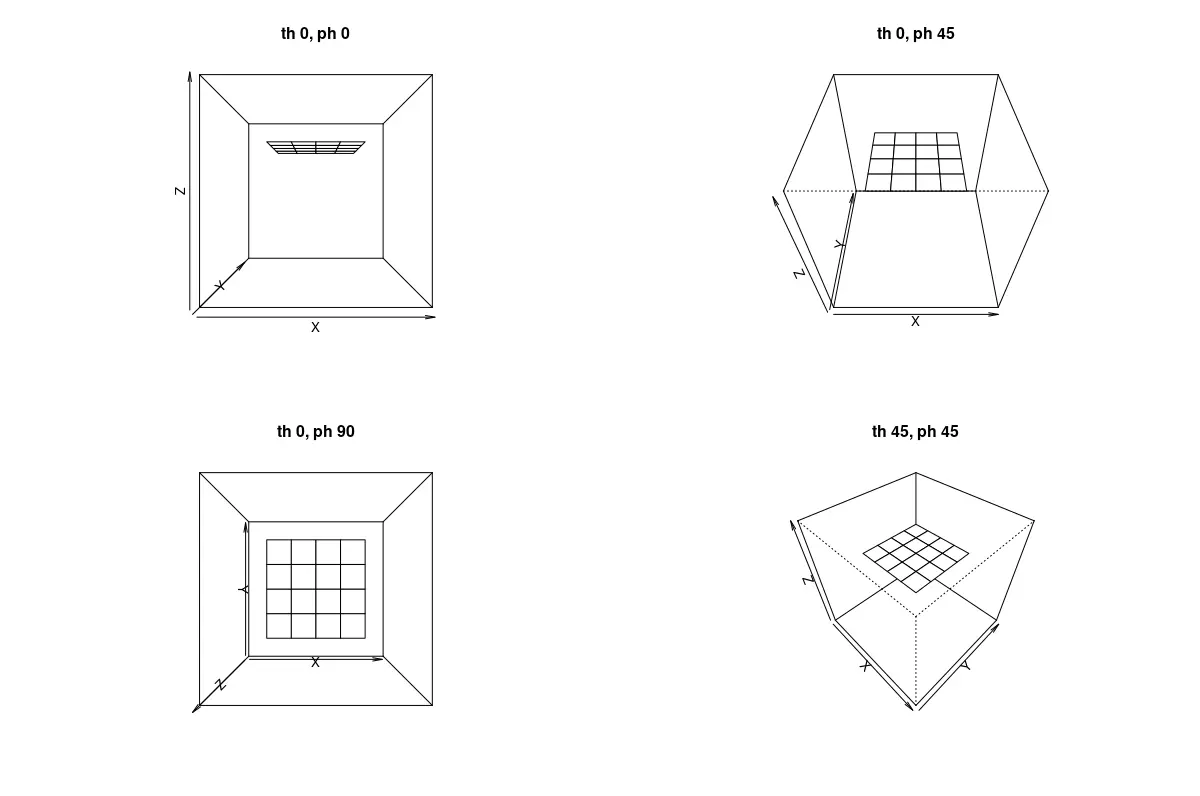
persp(x=X,y=Y,z=Z, theta=0, phi=45, xlim=range(-2,2), ylim=range(-2,2), zlim=range(-2,2))
persp(x=X,y=Y,z=Z, theta=0, phi=90, xlim=range(-2,2), ylim=range(-2,2), zlim=range(-2,2))
persp(x=X,y=Y,z=Z, theta=45, phi=45, xlim=range(-2,2), ylim=range(-2,2), zlim=range(-2,2))
輸出數字:

這四個圖說明了改變角度 theta 和 phi 的效果。
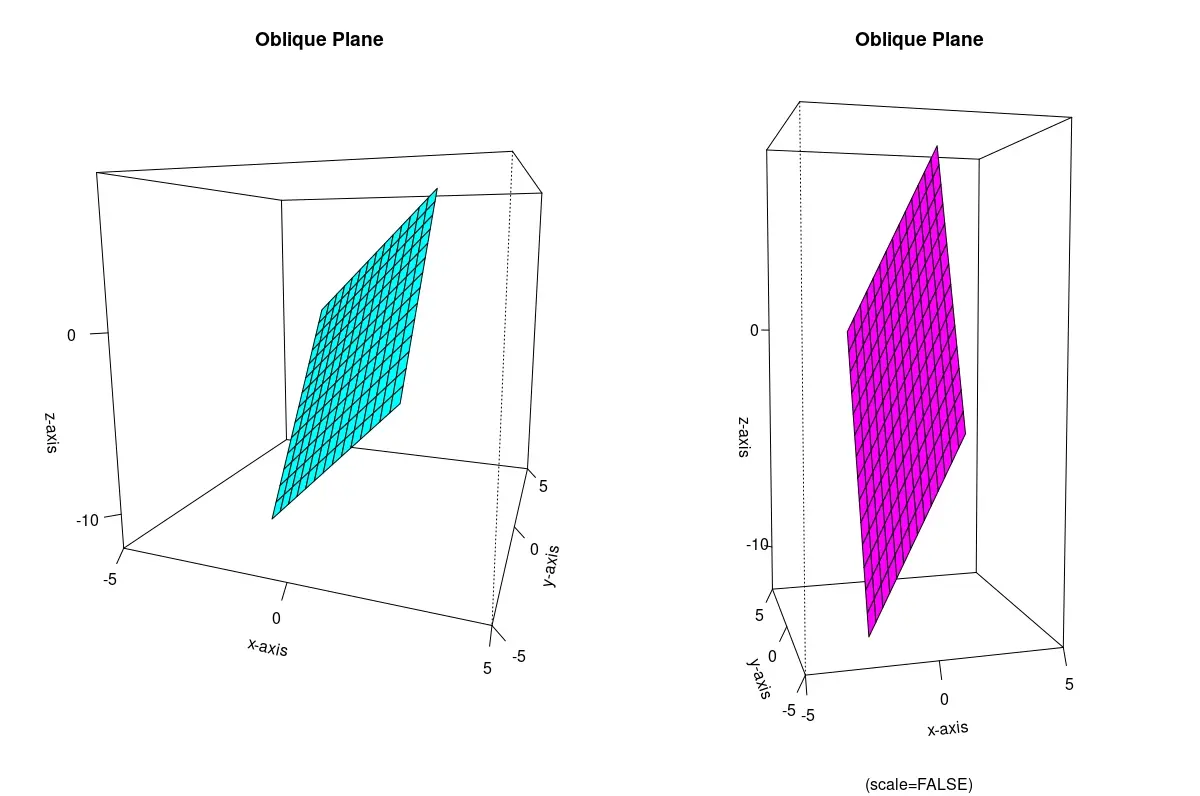
接下來,我們將看一個斜面。該語法還說明了設定其他 persp() 函式引數。
示例程式碼:
# A function for a plane.
O = function(x, y){
  return (2*x+3*y-2)
}

X1 = seq(-2,2,length.out=15)
Y1 = seq(-2,2, length.out=15)

# Apply the function to all combinations of x and y.
Z1 = outer(X1, Y1, O)

# Check the range of the values of Z.
# This will help create the limits for the box.
range(Z1)

# Because we do not use the scale=FALSE argument, the output is a cube.
# The axes are scaled.
persp(x=X1,y=Y1,z=Z1, theta=20, phi=10, xlim=range(-5,5), ylim=range(-5,5), zlim=range(-12,8),
      xlab="x-axis",
      ylab="y-axis",
      zlab="z-axis",
      main="Oblique Plane",
      col="#00FFFF",
      ticktype="detailed",
      nticks=3)

# With scale=FALSE.
persp(x=X1,y=Y1,z=Z1, theta=-15, phi=5, xlim=range(-5,5), ylim=range(-5,5), zlim=range(-12,8),
      scale = FALSE,
      xlab="x-axis",
      ylab="y-axis",
      zlab="z-axis",
      main="Oblique Plane",
      col="#FF00FF",
      ticktype="detailed",
      nticks=3)
輸出數字:

從 R 中的矩陣繪製
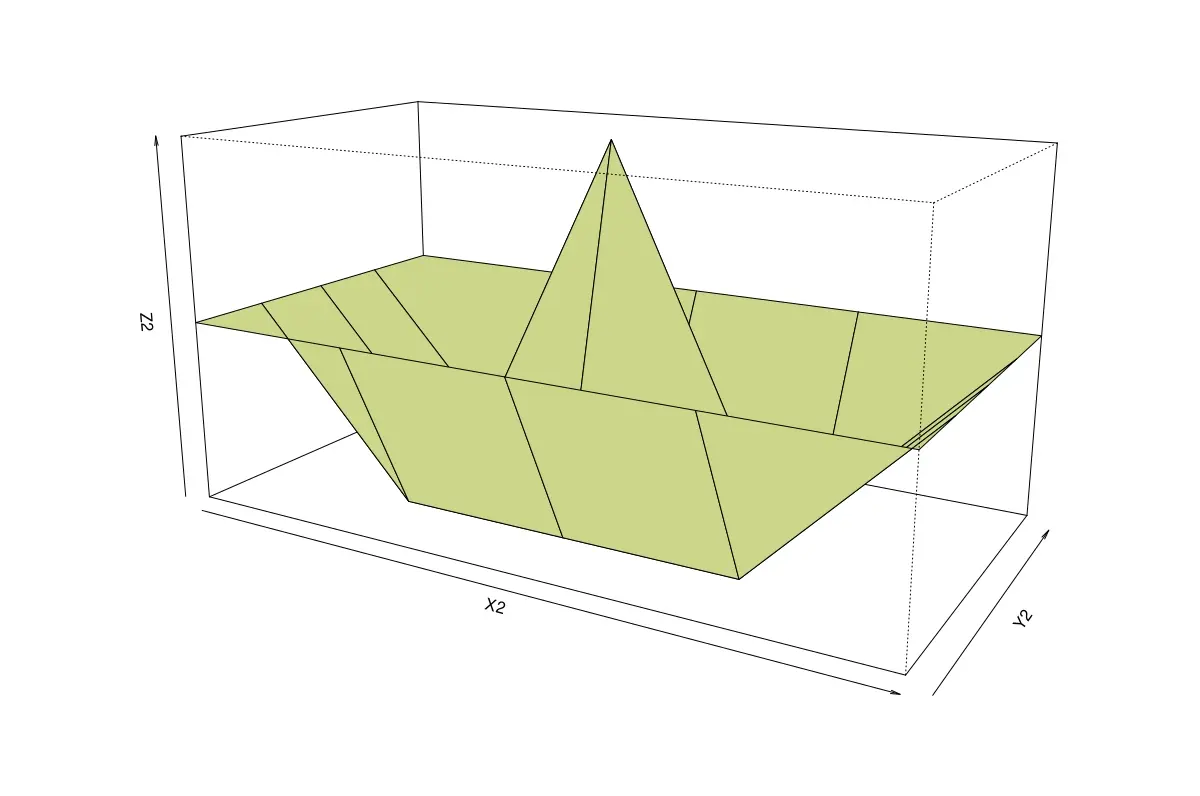
persp() 函式可以從對應於向量 x 和 y 的 z 值矩陣按升序繪製。
z 的行數和列數必須分別與 x 和 y 的長度匹配。
示例程式碼:
# Manually create a matrix of z values corresponding
# to all combinations of some x and y.
# (Or use such a pre-existing matrix.)
Z2 = matrix(data=c(1,1,1,1,1,
                  1,-1,-1,-1,1,
                  1,-1,3,-1,1,
                  1,-1,-1,-1,1,
                  1,1,1,1,1), ncol=5)

X2 = seq(-4, 4, length.out=5)
Y2 = seq(-2, 2, by=1)

persp(x=X2, y=Y2, z=Z2, scale=FALSE, col="#CBD68A", theta=30, phi=15)
輸出圖:

作者: Jesse John
