修改 R 中的 ggplot X 軸刻度標籤
本文將介紹如何在 R 中修改 ggplot x 軸刻度標籤。
使用 scale_x_discrete 修改 R 中的 ggplot X 軸刻度標籤
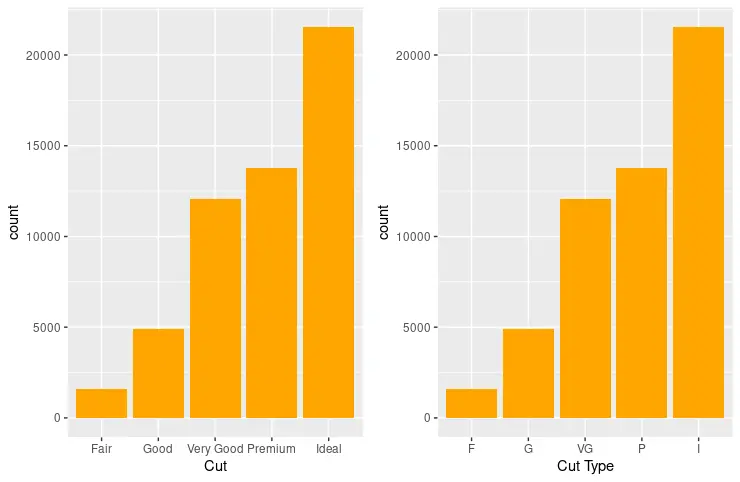
scale_x_discrete 與 scale_y_discrete 一起用於對繪圖比例標籤和限制進行高階操作。在這種情況下,我們使用 scale_x_discrete 來修改 ggplot 物件的 x 軸刻度標籤。請注意,第一個 ggplot 物件是基於 diamonds 資料集的條形圖。該圖使用 cut 列並在 y 軸上繪製每種型別的計數。x 軸具有預設標題 - cut,可以通過將字串作為 scale_x_discrete 的第一個引數進行修改。或者,我們可以通過構造一個向量並將其分配給 labels 引數來為每個標籤傳遞特定的字串值。兩個圖都是使用 grid.arrange 函式並排繪製的,grid.arrange 函式是 gridExtra 包的一部分。
library(ggplot2)
library(gridExtra)

p1 <- ggplot(diamonds, aes(cut)) + geom_bar(fill = "orange") + scale_x_discrete("Cut")
p2 <- p1 + scale_x_discrete("Cut Type", labels = c("Fair" = "F","Good" = "G", "Very Good" = "VG","Premium" = "P","Ideal" = "I"))

grid.arrange(p1, p2, ncol = 2)
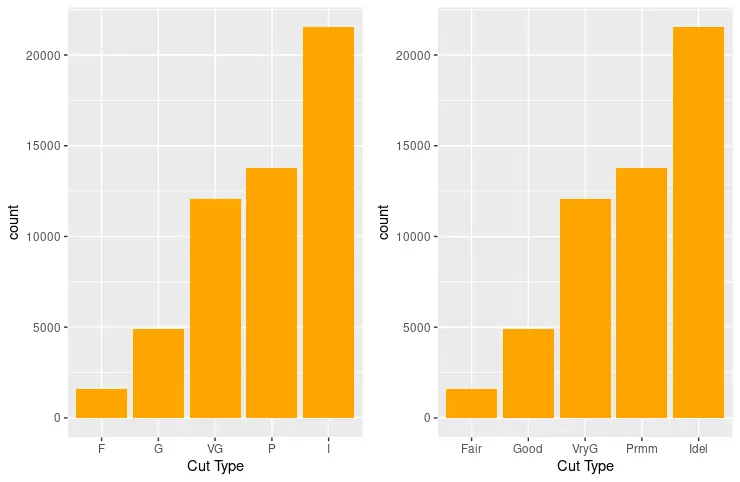
修改 x 軸上標籤的另一種有用方法是將函式物件作為 labels 引數傳遞。下一個程式碼片段使用 abbreviate 函式自動縮短標籤,然後將圖形繪製為兩列。
library(ggplot2)
library(gridExtra)

p1 <- ggplot(diamonds, aes(cut)) + geom_bar(fill = "orange") + scale_x_discrete("Cut")
p2 <- p1 + scale_x_discrete("Cut Type", labels = c("Fair" = "F","Good" = "G", "Very Good" = "VG","Premium" = "P","Ideal" = "I"))
p3 <- p1 + scale_x_discrete("Cut Type", labels = abbreviate)

grid.arrange(p2, p3, ncol = 2)
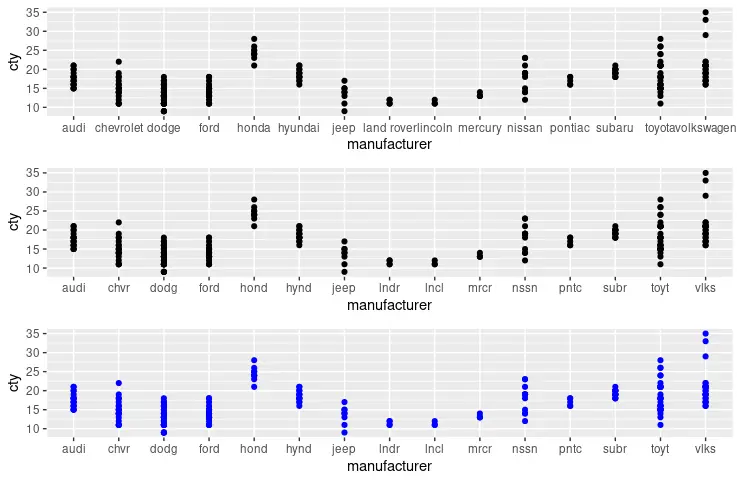
scale_x_discrete 在不同的圖上的工作方式類似,標籤操作技術是適用的,如下例所示。也就是說,從 mpg 資料集中繪製了幾個散點圖。
library(ggplot2)
library(gridExtra)

p1 <- ggplot(mpg, aes(manufacturer, cty)) + geom_point()

p2 <- ggplot(mpg, aes(manufacturer, cty)) + geom_point() +
  scale_x_discrete(labels = abbreviate)

p3 <- ggplot(mpg, aes(manufacturer, cty)) + geom_point(colour = "blue") +
  scale_x_discrete(labels = abbreviate)

grid.arrange(p1, p2, p3, nrow = 3)
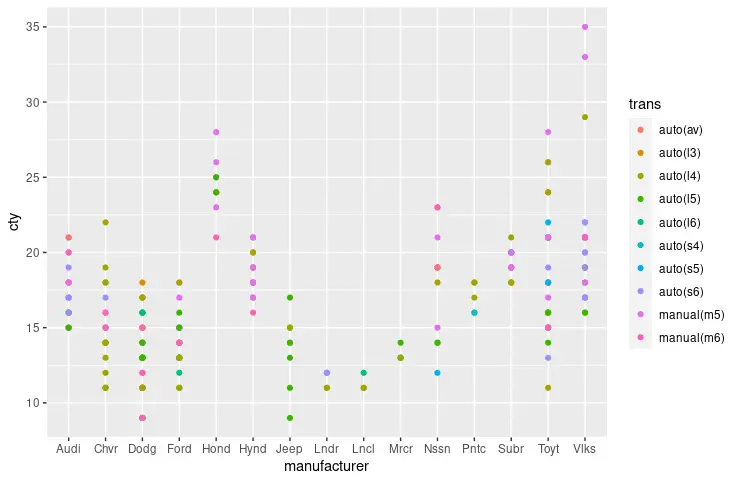
使用 scale_x_discrete 和自定義函式來修改 R 中的 ggplot X 軸刻度標籤
scale_x_discrete 引數 labels 可以採用自定義函式物件來相應地修改每個刻度標籤。在這種情況下,我們實現了 capitalize_all 函式,它首先縮寫每個標籤,然後將字串的起始字元轉換為大寫字母。請注意,paste、toupper、substring 和 abbreviate 內建函式用於實現 capitalize_all 功能,但對這些方法的全面回顧超出了本文的範圍。可以在 R 控制檯中使用 ?function_name 表示法顯示手冊頁。
library(ggplot2)
library(gridExtra)

capitalize_all <- Vectorize(function(x) {
  s <- abbreviate(x)
  paste(toupper(substring(s, 1,1)), substring(s, 2), sep="", collapse=" ")
})

ggplot(mpg, aes(manufacturer, cty)) + geom_point(aes(colour = trans)) +
  scale_x_discrete(labels = capitalize_all)

Founder of DelftStack.com. Jinku has worked in the robotics and automotive industries for over 8 years. He sharpened his coding skills when he needed to do the automatic testing, data collection from remote servers and report creation from the endurance test. He is from an electrical/electronics engineering background but has expanded his interest to embedded electronics, embedded programming and front-/back-end programming.
LinkedIn