在 Python 中建立詞雲
Preet Sanghavi
2024年2月15日

本教程將介紹一種使用 wordcloud 包在 Python 中建立詞雲的方法。
在 Python 中安裝 wordcloud 包
首先,我們必須在 Python 中安裝 wordcloud 包,包括 Matplotlib 包。
pip install wordcloud
上面的命令將安裝 wordcloud 和 Matplotlib 包,我們將使用它們來建立詞雲。
現在,讓我們匯入建立詞雲所需的庫,即 WordCloud、STOPWORDS 和 matplotlib.pyplot。
在 Python 中匯入相關庫
from wordcloud import WordCloud, STOPWORDS
import matplotlib.pyplot as plt
上面的程式碼將匯入所有需要的庫。
現在讓我們建立一組停用詞來幫助我們避免在示例字串的詞雲中新增停用詞。
stopwords = set(STOPWORDS)
讓我們取一個示例字串,從中我們將建立一個包含字串中最常見單詞的詞雲。
text_str = (
    "peep gate do it but peep heal gate also not  heal do it but gate peep peep peep"
)
用 Python 生成詞雲
我們將在函式中使用這個字串來建立詞雲。現在讓我們建立一個函式 present_wordcloud(),我們使用帶有所有合適引數的 Worcloud() 函式來建立詞雲。
def present_wordcloud(stri, title=None):
    wordcloud = WordCloud(
        background_color="white",
        stopwords=stopwords,
        max_words=300,
        max_font_size=50,
        scale=3,
        random_state=1,
    ).generate(str(stri))
在上面的程式碼中,我們將合適的引數傳遞給我們的函式,並將我們的字串傳遞給 generate() 函式以生成詞雲。現在,我們將通過在我們的 present_wordcloud() 函式中新增以下程式碼,使用 Matplotlib 庫顯示我們的詞雲。
def present_wordcloud(stri, title=None):
    wordcloud = WordCloud(
        background_color="white",
        stopwords=stopwords,
        max_words=200,
        max_font_size=40,
        scale=3,
        random_state=1,
    ).generate(str(stri))

    fig = plt.figure(1, figsize=(9, 9))
    plt.axis("off")
    if title:
        fig.suptitle(title, fontsize=18)
        fig.subplots_adjust(top=2.4)

    plt.imshow(wordcloud)
    plt.show()
如上所示,我們通過將圖形大小、副標題和字型大小新增到 plt 螢幕來顯示我們的詞雲。plt.imshow() 函式將在螢幕上顯示詞雲。
現在執行 present_wordcloud() 函式,通過執行以下程式碼檢視為我們的示例字串生成的詞雲。
if __name__ == "__main__":

    present_wordcloud(text_str)
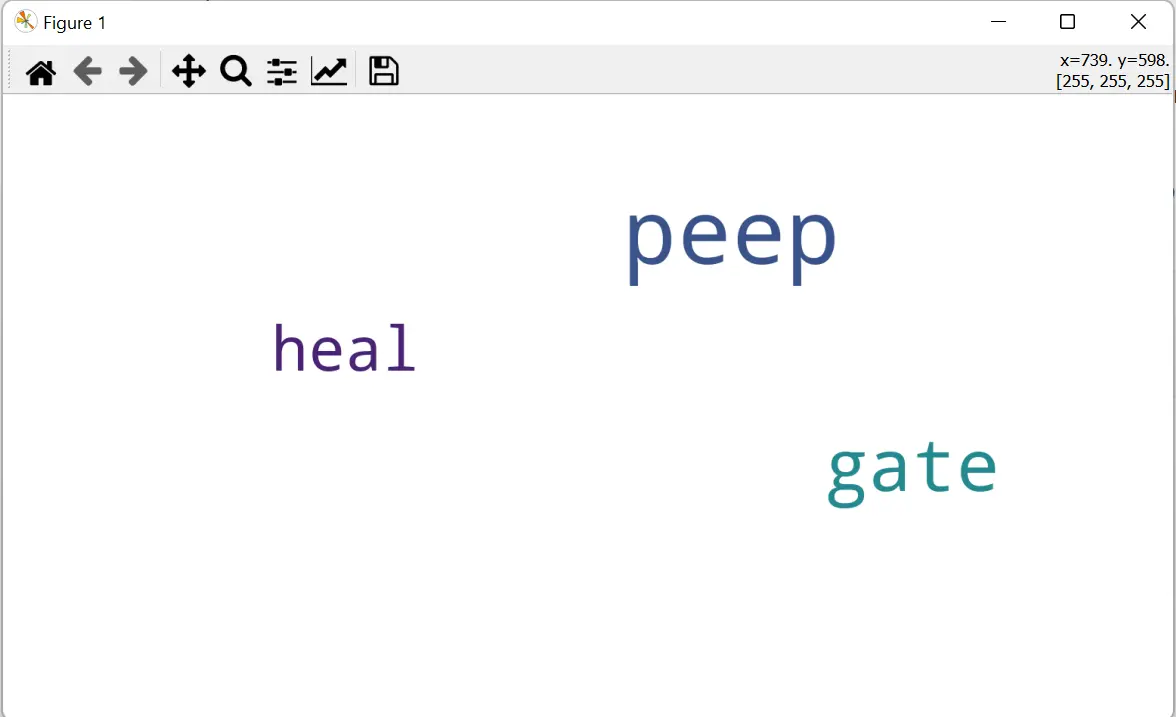
通過執行我們的 main 函式,我們得到以下輸出。

我們從示例字串中得到了一個詞雲,其中 peep 是我們句子中最常見的詞。
這樣我們就成功地在 Python 中建立了一個詞雲。
作者: Preet Sanghavi
