如何漂亮地列印整個 Pandas Series/DataFrame
Asad Riaz
2023年1月30日

我們將介紹各種方法來漂亮地列印整個 Pandas Series/DataFrame,例如 option_context,set_option 和 options.display。
option_context 漂亮列印 Pandas DataFrame
我們可以將 option_context 與一個或多個選項一起使用:
# python 3.x
import pandas as pd
import numpy as np

df = pd.DataFrame(np.random.randn(5, 10))
with pd.option_context(
    "display.max_rows", None, "display.max_columns", None
):  # more options can be specified also
    print(df)
輸出:
          0         1         2         3         4         5         6  \
0  0.536629 -0.317664  1.109011 -0.690963  0.895591 -2.008769 -0.323554
1  1.978043  1.179393 -0.923501 -1.086199  1.311835  0.281665  0.132701
2 -0.119101  0.339344  0.445792  0.544024 -0.780646 -0.505816  0.709910
3 -0.092554 -1.547887  0.895174  0.998706 -0.480896 -0.969276 -0.050267
4 -0.433900 -0.242806  2.435337 -0.299294 -1.011233  0.556583 -1.466501

          7         8         9
0 -2.454773  1.477553 -1.274452
1  0.524635 -0.707736 -0.283512
2  1.381855  1.676523 -0.206820
3 -2.183197 -0.061560 -0.295834
4  0.168427 -0.278612 -0.812824
set_option() 可以不會被截斷的顯示
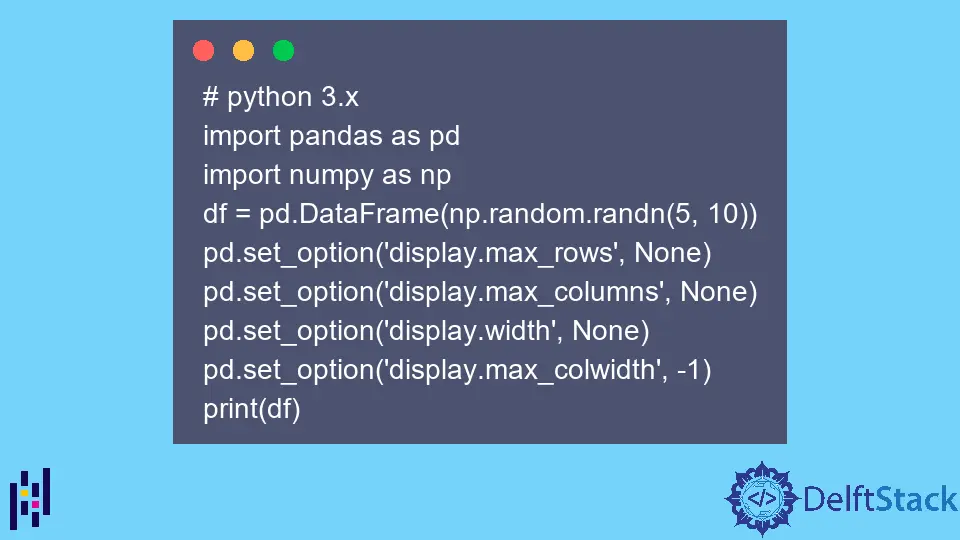
要顯示 DataFrame 的完整內容,我們需要設定以下 4 個選項:
# python 3.x
import pandas as pd
import numpy as np

df = pd.DataFrame(np.random.randn(5, 10))
pd.set_option("display.max_rows", None)
pd.set_option("display.max_columns", None)
pd.set_option("display.width", None)
pd.set_option("display.max_colwidth", -1)
print(df)
輸出:
          0         1         2         3         4         5         6         7         8         9
0 -0.137170  0.491314  0.213574  0.794829  0.244942 -0.472234  0.090120 -0.349087  1.496215 -0.674469
1  1.575921 -0.447399 -1.254165  1.865231 -0.112770  0.535931 -1.092489  0.032282 -0.501178 -0.521661
2  1.390534  0.147977 -0.908857  0.876250 -0.260842  0.873867  1.199424 -1.058784  0.278643  1.623892
3 -0.277710 -0.137027 -0.347331 -0.133104  0.495571  0.770674  0.819736 -0.130426  0.556820 -0.599270
4  0.146928  0.726470 -0.831788 -0.922454 -0.835223  0.494688  0.182850 -0.916735  0.678326 -0.953774
用於顯示大型 DataFrame 的 options.display
作為 display.context 的替代方法,我們設定這樣的選項以顯示大型 DataFrame:
# python 3.x
import pandas as pd
import numpy as np

df = pd.DataFrame(np.random.randn(5, 10))


def set_pandas_display_options() -> None:
    display = pd.options.display
    display.max_columns = 100
    display.max_rows = 100
    display.max_colwidth = 199
    display.width = None


set_pandas_display_options()
print(df)
輸出:
          0         1         2         3         4         5         6         7         8         9
0 -1.915164 -1.953066  0.279874 -1.841046  0.105823 -2.070710 -0.075651 -0.110299  0.892385 -1.270936
1  0.135022 -0.088581 -0.257854  0.167365  1.593467 -0.131887  0.780474 -0.394496 -1.942498  0.192672
2 -0.276460  0.225853 -0.896788 -0.639678  1.867691 -1.457160 -0.902934 -0.546596  0.928684 -0.041108
3  0.851837  0.526239  1.187710  0.139416  0.546204  0.409457  0.542819 -1.174244 -3.118918  0.086719
4  0.402529 -0.724139 -0.294063 -0.725560  1.159756  0.493684  0.277930  0.384105 -0.475742  0.675826