Plotly 疊加面積圖
Ammar Ali
2024年2月15日

本教程將討論使用 Plotly 的 scatter() 函式的 stackgroup 引數建立堆積面積圖。
Plotly 堆積面積圖
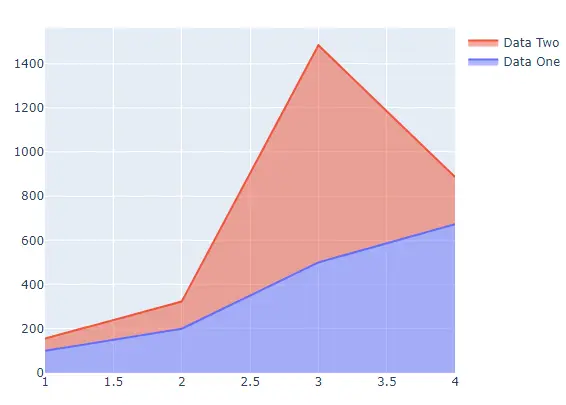
堆積面積圖包含多個不同資料框的區域。我們可以使用 scatter() 函式的 stackgroup() 引數在同一張圖上繪製多個區域。
建立散點圖後,我們可以使用 add_trace() 函式新增另一個區域,該函式在同一圖中新增資料。
例如,讓我們使用一些隨機資料來建立散點圖,然後使用 add_trace() 函式新增另一個區域。請參閱下面的程式碼。
import plotly.graph_objects as go

x = [1, 2, 3, 4]
plot = px.Figure(
    go.Scatter(name="Data One", x=x, y=[100, 200, 500, 673], stackgroup="one")
)

plot.add_trace(
    go.Scatter(name="Data Two", x=x, y=[56, 123, 982, 213], stackgroup="one")
)

plot.show()
輸出:

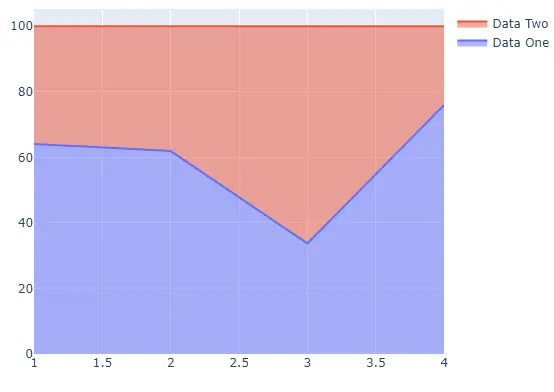
我們還可以使用 groupnorm 引數更改圖形的規範化,並將其值設定為堆疊組總和的百分比。
例如,讓我們使用標準化值繪製上圖。請參閱下面的程式碼。
import plotly.graph_objects as go

x = [1, 2, 3, 4]
plot = px.Figure(
    go.Scatter(
        name="Data One",
        x=x,
        y=[100, 200, 500, 673],
        stackgroup="one",
        groupnorm="percent",
    )
)

plot.add_trace(
    go.Scatter(name="Data Two", x=x, y=[56, 123, 982, 213], stackgroup="one")
)

plot.show()
輸出:

我們可以使用 add_trace() 函式在建立散點圖中新增另一個區域。儘管如此,我們也可以在建立圖形時通過將資料儲存在變數中然後使用該變數繪製堆積面積圖來做到這一點。
例如,讓我們再次建立堆積面積圖。請參閱下面的程式碼。
import plotly.graph_objects as go

x = [1, 2, 3, 4]
data = [
    go.Scatter(name="Data One", x=x, y=[100, 200, 500, 673], stackgroup="one"),
    go.Scatter(name="Data Two", x=x, y=[56, 123, 982, 213], stackgroup="one"),
]

plot = px.Figure(data)
plot.show()
輸出:

作者: Ammar Ali
