教程列表
技巧貼士
函數參考
zh-tw
ZH
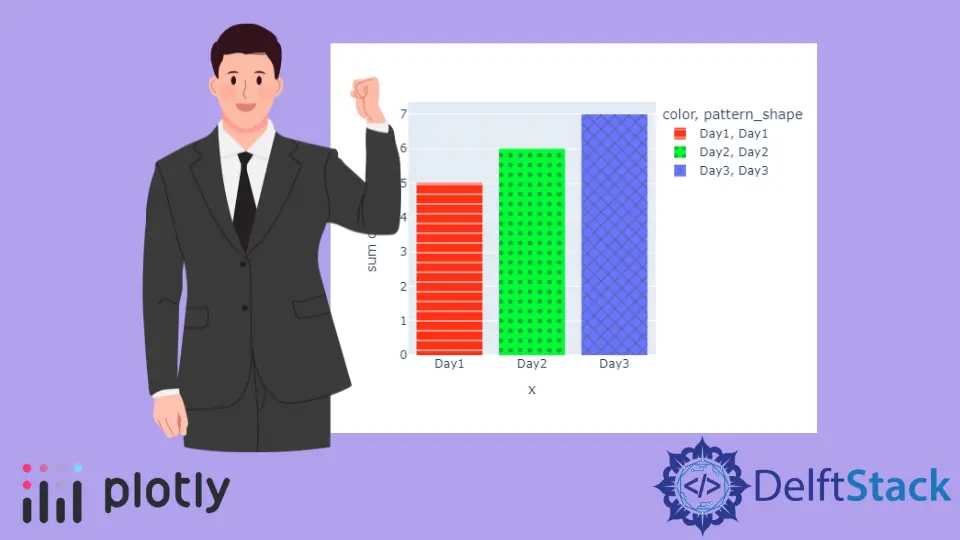
Plotly 條形圖
本教程將討論使用 Plotly 的 bar() 函式建立條形圖。 Plotly 條形圖 條形圖將資料顯示為矩形條,其高度等於它所代表的值。我們可以使用 Plotly 的 bar() 函式來建立條形圖。
Plotly
Plotly Plot
Tags
Plotly Plot
Plotly Table
Python Plotly
Python Plotly Plot
Python Bubble Chart
Plotly Map
最受歡迎文章
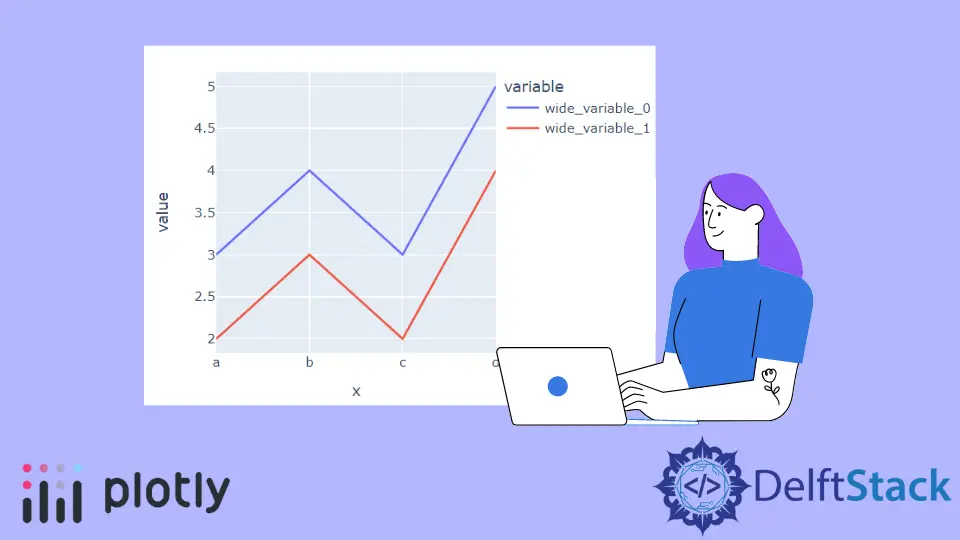
Plotly 線形圖
Plotly
Plotly Plot
Plotly 甘特圖
Plotly
Plotly Plot
Plotly 3D 散點圖
Plotly
Plotly Plot
Plotly 餅圖
Plotly
Plotly Plot
Plotly 直方圖
Plotly
Plotly Plot
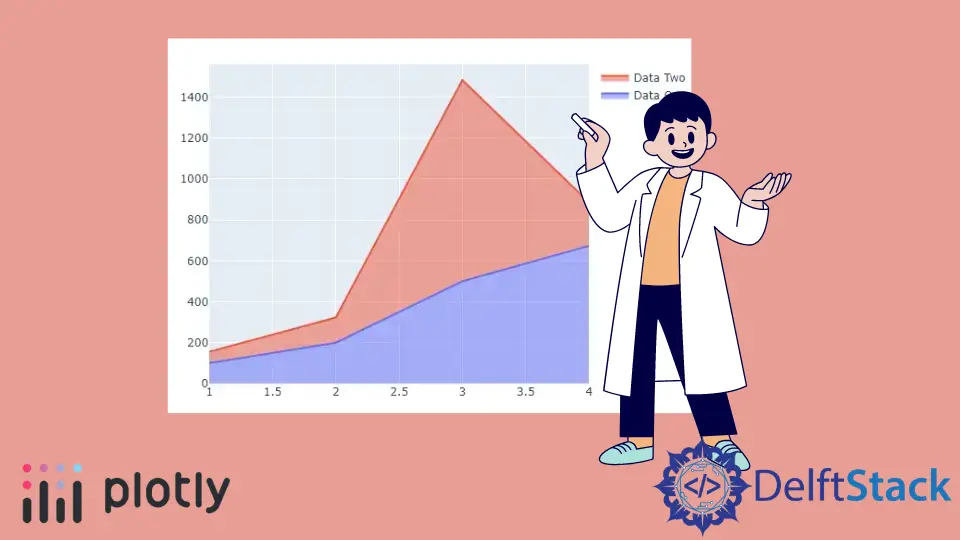
Plotly 疊加面積圖
Plotly
Plotly Plot
Plotly 條形圖
Plotly
Plotly Plot
Plotly 貼士
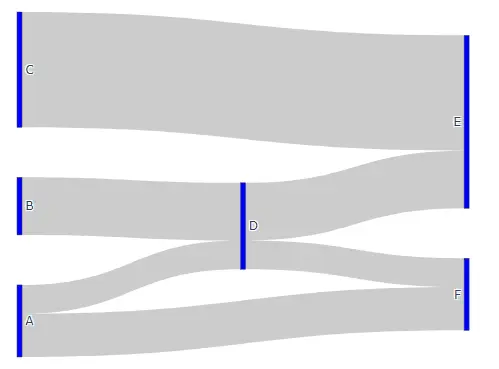
Plotly 桑基圖
Plotly
Plotly Plot
最近更新的文章
Plotly 疊加面積圖
Plotly
Plotly Plot
Plotly 樹狀圖
Plotly
Plotly Plot
Plotly 箱型圖
Plotly
Plotly Plot
Plotly 熱圖
Plotly
Plotly Plot
Plotly 等值線圖
Plotly
Plotly Map
Plotly 氣泡圖
Python
Python Plotly
Python Plotly Plot
Python Bubble Chart
Plotly 桑基圖
Plotly
Plotly Plot
Plotly 表
Plotly
Plotly Table
Plotly 直方圖
Plotly
Plotly Plot