Matplotlib 中的次要刻度
Maxim Maeder
2023年1月30日

本教程教你如何在 Matplotlib 中使用和格式化次要刻度。Matplotlib 是一個 Python 資料視覺化繪相簿。
在使用繪圖之前,我們需要設定我們的指令碼以使用該庫。我們首先匯入 Matplotlib,然後從 random 模組載入 randrange 函式以快速生成一些資料。
請記住,你的輸出看起來會有所不同。
程式碼示例:
import matplotlib.pyplot as plt
from random import randrange

data_1 = [randrange(0, 10) for _ in range(0, 10)]
data_2 = [randrange(0, 10) for _ in range(0, 10)]
在 Matplotlib 中啟用 Minor Ticks
在 Matplotlib 中啟用次要刻度就像呼叫 pyplot.minorticks_on() 方法一樣簡單。
程式碼示例:
plt.plot(data_1)
plt.minorticks_on()
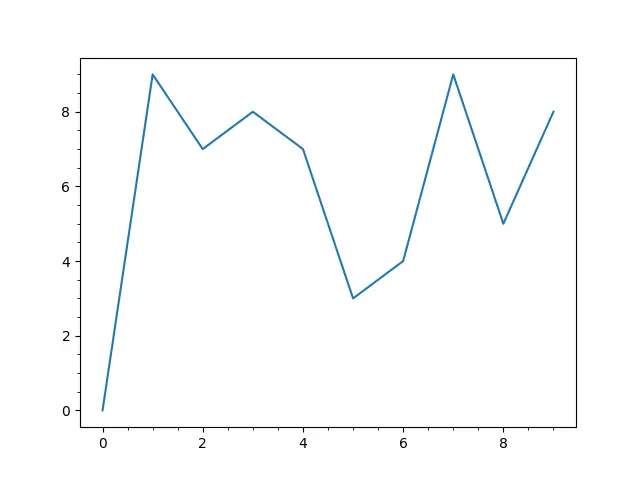
請記住,由於隨機生成的數字,你的繪圖看起來會有所不同。如你所見,較大的編號之間沒有次要刻度。
輸出:

Matplotlib 中的樣式次要刻度
我們還可以設定次要/主要刻度的樣式,使其看起來更符合我們的喜好。我們使用 pyplot.tick_params() 方法來做到這一點。
在以下示例中,我應用了一些樣式選項。
程式碼示例:
# For the X Axis
plt.tick_params(axis="x", which="minor", length=10, color="r")

# For the Y Axis
plt.tick_params(axis="y", which="major", length=10, color="g", labelrotation=45.0)

plt.show()
該函式採用 axis 引數,該引數確定以下樣式應用於哪個軸,而 which 引數確定它是應用於主要刻度還是次要刻度。現在有很多選項來設定你的刻度。
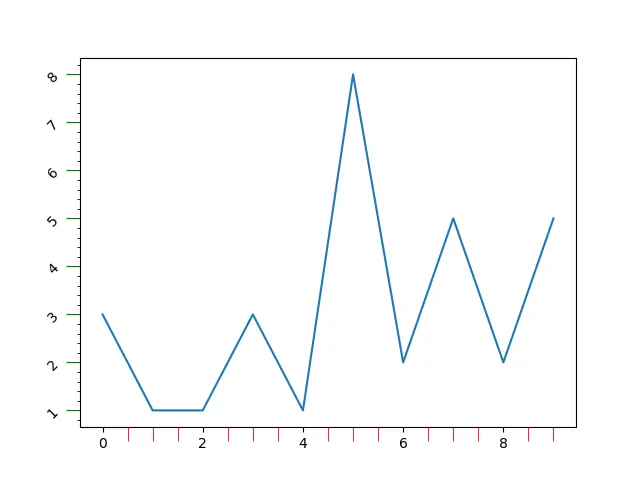
輸出:

底部的次要刻度現在是紅色的並且在上面的輸出中更長。側面的刻度是綠色的,它們的標籤旋轉了 45 度。
現在你知道了如何在 Matplotlib 中啟用和設定次要刻度。
完整程式碼:
import matplotlib.pyplot as plt
from random import randrange

data_1 = [randrange(0, 10) for _ in range(0, 10)]

plt.plot(data_1)
plt.minorticks_on()

# For the X Axis
plt.tick_params(axis="x", which="minor", length=10, color="r")

# For the Y Axis
plt.tick_params(axis="y", which="major", length=10, color="g", labelrotation=45.0)

plt.show()
作者: Maxim Maeder
Hi, my name is Maxim Maeder, I am a young programming enthusiast looking to have fun coding and teaching you some things about programming.
GitHub