在 Matplotlib 的圖上畫垂直線
Vaibhav Vaibhav
2024年2月15日
在處理圖表時,我們經常需要在圖表上繪製水平線和垂直線來描繪一些資訊。它可以是某個平均值、某個閾值或某個範圍。本文將討論如何在 Python 中使用 Matplotlib 生成的圖上建立垂直線。
在 Matplotlib 中使用 axvline() 繪製垂直線
axvline() 是來自 Matplotlib 庫的一個函式,它沿著軸繪製垂直線。這個函式佔用了很多引數,但我們將討論其中的三個,如下所示。
x: The position of the line on thex-axisymin:該值應介於 0 和 1 之間,其中 0 表示圖的底部,1 表示圖的頂部。ymax:該值應介於 0 和 1 之間,其中 0 表示圖的底部,1 表示圖的頂部。
其他引數包括 color、label、marker、snap、transform、url、visible 等。
請參閱以下示例以瞭解如何使用這個函式。
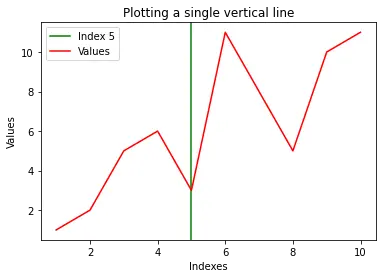
示例 1 - 繪製一條垂直線
import random
import numpy as np
import matplotlib.pyplot as plt

x = np.array([1, 2, 3, 4, 5, 6, 7, 8, 9, 10])
y = np.array([1, 2, 5, 6, 3, 11, 8, 5, 10, 11])
# Plotting a single vertical line
plt.axvline(x=5, color="green", label="Index 5")
plt.plot(x, y, color="red", label="Values")
plt.title("Plotting a single vertical line")
plt.xlabel("Indexes")
plt.ylabel("Values")
plt.legend()
plt.show()
輸出:
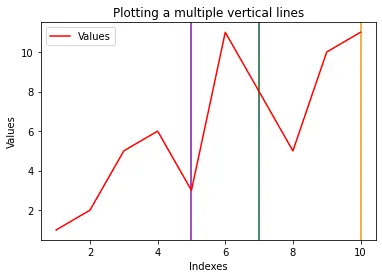
示例 2 - 繪製多條垂直線
import random
import numpy as np
import matplotlib.pyplot as plt

x = np.array([1, 2, 3, 4, 5, 6, 7, 8, 9, 10])
y = np.array([1, 2, 5, 6, 3, 11, 8, 5, 10, 11])

for i in range(3):
    plt.axvline(
        x=random.randint(1, 10),
        color=np.random.rand(
            3,
        ),
    )  # Plotting a vertical line

plt.plot(x, y, color="red", label="Values")
plt.title("Plotting multiple vertical lines")
plt.xlabel("Indexes")
plt.ylabel("Values")
plt.legend()
plt.show()
輸出:
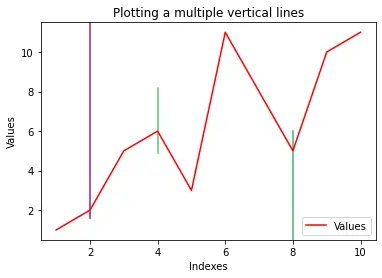
示例 3 - 具有可變長度的多條線
import random
import numpy as np
import matplotlib.pyplot as plt

x = np.array([1, 2, 3, 4, 5, 6, 7, 8, 9, 10])
y = np.array([1, 2, 5, 6, 3, 11, 8, 5, 10, 11])
yMins = [1, 0.7, 0.5]
yMaxs = [0.1, 0.4, 0]
positions = [2, 4, 8]

for i in range(3):
    plt.axvline(
        x=positions[i],
        ymin=yMins[i],
        ymax=yMaxs[i],
        color=np.random.rand(
            3,
        ),
    )  # Plotting a vertical line

plt.plot(x, y, color="red", label="Values")
plt.title("Plotting a multiple vertical lines")
plt.xlabel("Indexes")
plt.ylabel("Values")
plt.legend()
plt.show()
輸出:
作者: Vaibhav Vaibhav
