Matplotlib 3D 投影
Suraj Joshi
2024年2月15日

本教程解釋了我們如何使用 mpl_toolkits 庫中的 mplot3d 包在 Matplotlib 中建立 3D 圖。
在 Matplotlib 中繪製 3D 軸
from mpl_toolkits import mplot3d
import matplotlib.pyplot as plt

axes = plt.axes(projection="3d")
axes.set_title("3d axes in Matplotlib", fontsize=14, fontweight="bold")
axes.set_xlabel("X")
axes.set_ylabel("Y")
axes.set_zlabel("Z")
plt.show()
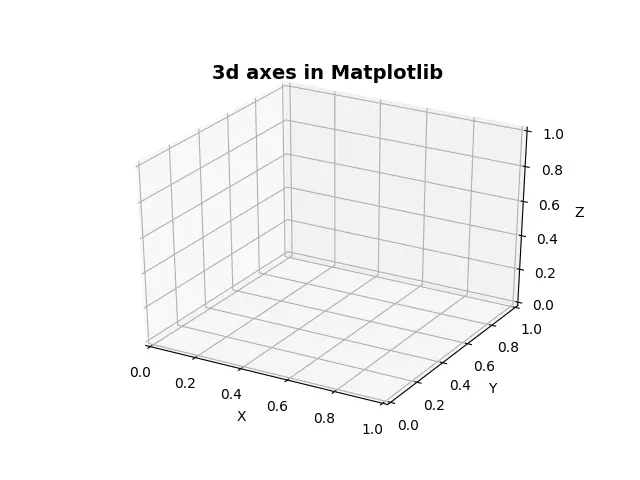
輸出:

它可以建立一個帶有 X、Y 和 Z 軸的三維圖。要建立一個 3D Matplotlib 圖,我們從 mpl_toolkits 庫中匯入 mplot3d 包。當我們使用 pip 安裝 Matplotlib 時,mpl_toolkits 就會被安裝。
在 Matplotlib 圖上繪製 3D 軸與繪製 2D 軸類似。我們只要在 matplotlib.pyplot.axes() 中設定 projection="3d",就可以在 Matplotlib 中繪製 3D 軸。
我們必須確保 Matplotlib 的版本是 1.0 或更高。
在 Matplotlib 中繪製 3D 散點圖
import numpy as np
from mpl_toolkits import mplot3d
import matplotlib.pyplot as plt

x = np.random.randint(20, size=60)
y = np.random.randint(15, size=60)
z = np.random.randint(10, size=60)

fig = plt.figure(figsize=(8, 6))
axes = plt.axes(projection="3d")
axes.plot3D(x, y, z, color="red")
axes.set_title("3d Line plot in Matplotlib", fontsize=14, fontweight="bold")
axes.set_xlabel("X")
axes.set_ylabel("Y")
axes.set_zlabel("Z")
plt.tight_layout()
plt.show()
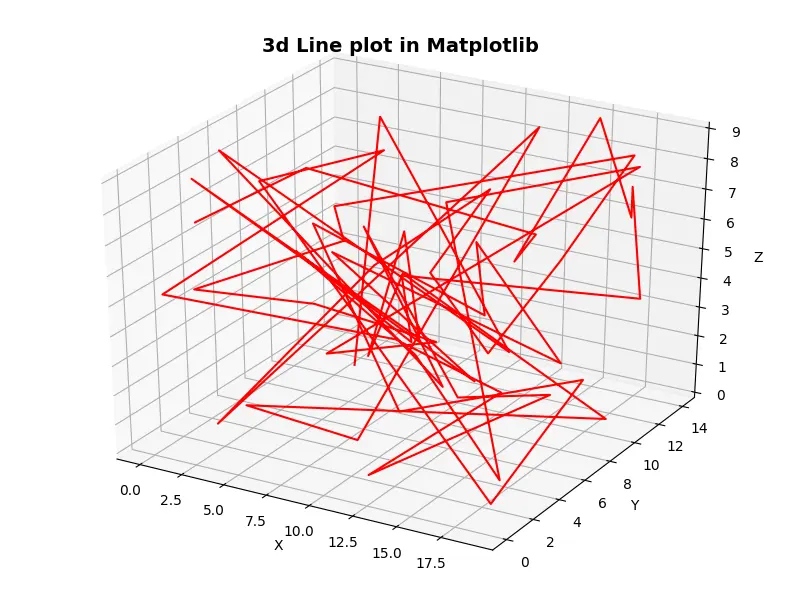
輸出:

它在 Matplotlib 中建立了一個 3D 線圖。要在 Matplotlib 中建立一個 3D 線圖,我們首先要建立軸,然後使用 plot3D() 方法建立 3D 線圖。我們將要繪製的點的 X、Y 和 Z 座標作為引數傳遞給 plot3D() 方法。
Matplotlib 中的 3D 散點圖
import numpy as np
from mpl_toolkits import mplot3d
import matplotlib.pyplot as plt

x = np.random.randint(20, size=60)
y = np.random.randint(15, size=60)
z = np.random.randint(10, size=60)

fig = plt.figure(figsize=(8, 6))
axes = plt.axes(projection="3d")
axes.scatter3D(x, y, z, color="red")
axes.set_title("3d Sactter plot in Matplotlib", fontsize=14, fontweight="bold")
axes.set_xlabel("X")
axes.set_ylabel("Y")
axes.set_zlabel("Z")
plt.tight_layout()
plt.show()
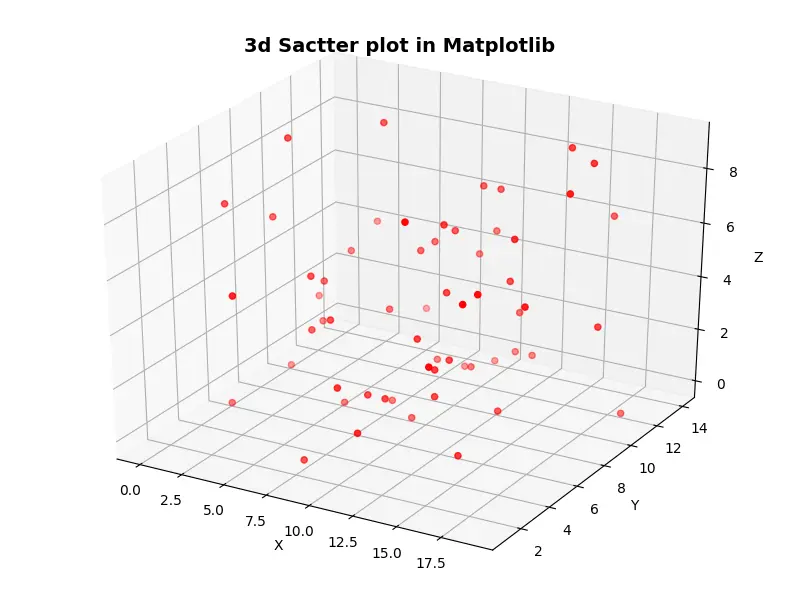
輸出:

它在 Matplotlib 中建立了一個 3D 散點圖。要在 Matplotlib 中建立一個 3D 散點圖,我們首先要建立軸,然後使用 scatter3D() 方法建立 3D 散點圖。我們將要繪製的點的 X、Y 和 Z 座標作為引數傳遞給 scatter3D() 方法。
需要注意的是,我們在二維繪圖函式名稱的末尾加上 3D,以生成相應的三維圖,例如:plot() 函式生成二維線圖,而 plot3D() 生成三維線圖。
作者: Suraj Joshi
Suraj Joshi is a backend software engineer at Matrice.ai.
LinkedIn