如何在 Matplotlib 中為所有子圖設定一個主標題
Suraj Joshi
2023年1月30日
我們使用 set_title(label) 和 title.set_text(label) 方法將標題新增到 Matplotlib 中的各個子圖中。但是,要為所有子圖新增通用的主標題,我們使用 pyplot.suptitle() 或 Figure.suptitle() 方法。
pyplot.suptitle() 為所有 Matplotlib 子圖新增主標題
我們使用 matplotlib.pyplot.suptitle() 方法來設定 Matplotlib 中所有子圖共有的主標題。
import numpy as np
import matplotlib.pyplot as plt

m1 = 1
c1 = 0

m2 = 2
c2 = 2

m3 = 2
c3 = 1

m4 = 1
c4 = 2

x = np.linspace(0, 3, 100)
y1 = m1 * x + c1
y2 = m2 * x + c2
y3 = m3 * x + c3
y4 = m4 * x + c4

fig, ax = plt.subplots(2, 2, figsize=(10, 8))

ax[0, 0].plot(x, y1)
ax[0, 1].plot(x, y2)
ax[1, 0].plot(x, y3)
ax[1, 1].plot(x, y4)

ax[0, 0].set_title("Line-1")
ax[0, 1].set_title("Line-2")
ax[1, 0].set_title("Line-3")
ax[1, 1].set_title("Line-4")

plt.suptitle("Various Straight Lines", fontsize=20)

fig.tight_layout()
plt.show()
輸出:
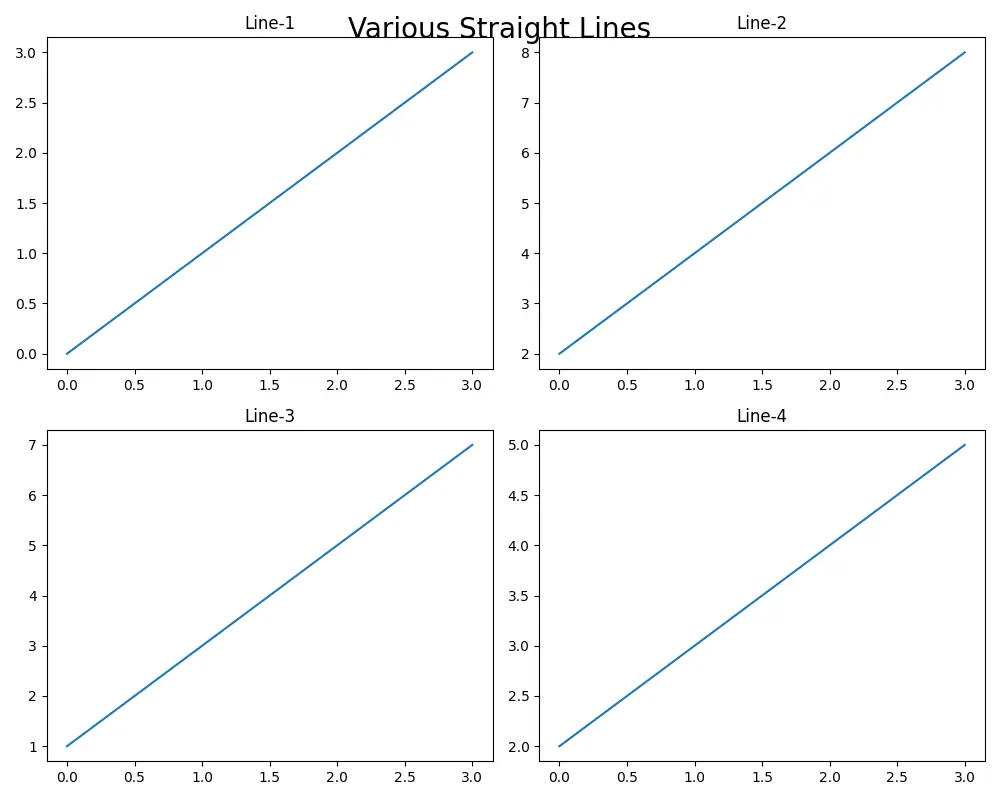
在這個例子中,axes.set_title() 方法用於向各個子圖新增標題,而 plt.suptitle() 方法用於對所有子圖新增通用標題。我們可以使用 plt.suptitle() 方法的各種引數來指定各種引數,例如 x 座標,y 座標,字型大小和對齊方式。在這種情況下,設定 fontsize=20 以使主標題與每個子圖的標題區分開。
figure.suptitle() 為所有 Matplotlib 子圖新增主標題
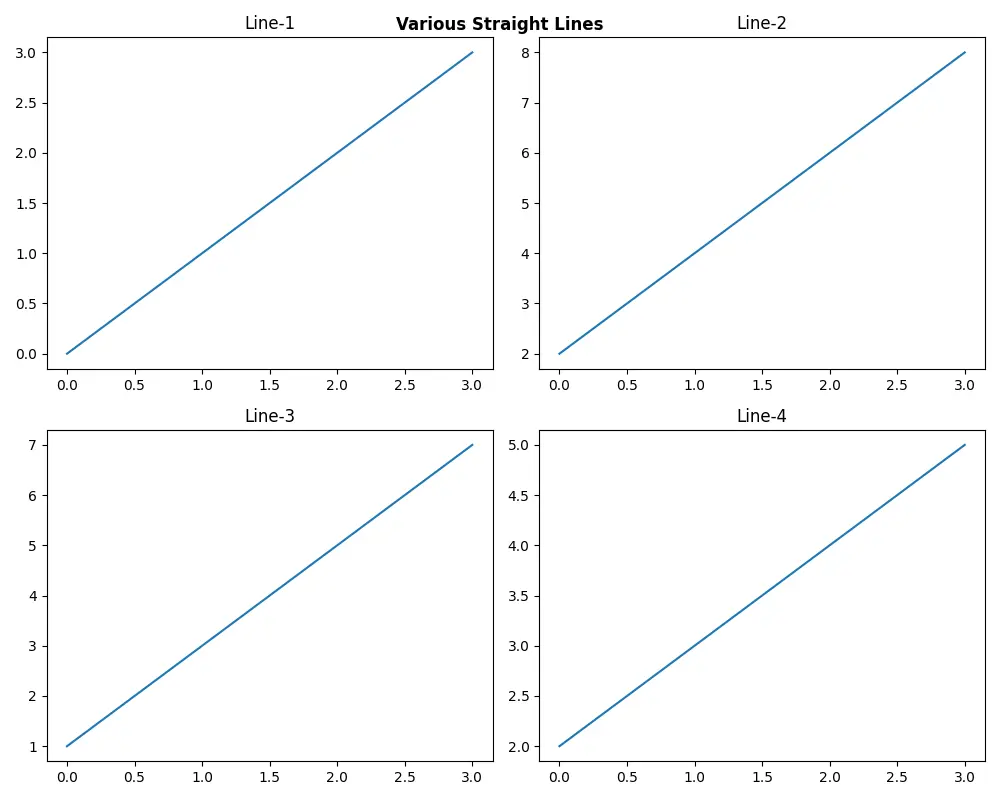
還可以使用 matplotlib.figure.Figure.suptitle() 方法為圖中的所有子圖設定主標題。
import numpy as np
import matplotlib.pyplot as plt

m1 = 1
c1 = 0

m2 = 2
c2 = 2

m3 = 2
c3 = 1

m4 = 1
c4 = 2

x = np.linspace(0, 3, 100)
y1 = m1 * x + c1
y2 = m2 * x + c2
y3 = m3 * x + c3
y4 = m4 * x + c4

fig, ax = plt.subplots(2, 2, figsize=(10, 8))

ax[0, 0].plot(x, y1)
ax[0, 1].plot(x, y2)
ax[1, 0].plot(x, y3)
ax[1, 1].plot(x, y4)

ax[0, 0].set_title("Line-1")
ax[0, 1].set_title("Line-2")
ax[1, 0].set_title("Line-3")
ax[1, 1].set_title("Line-4")

fig.suptitle("Various Straight Lines", fontweight="bold")

fig.tight_layout()
plt.show()
輸出:
作者: Suraj Joshi

Suraj Joshi is a backend software engineer at Matrice.ai.
LinkedIn