Matplotlib 中如何同時繪製兩個直方圖
Jinku Hu
2023年1月30日
我們可以在一個圖中同時繪製兩個直方圖。下面顯示了建立帶有和不帶有重疊條形圖的兩個直方圖的方法。
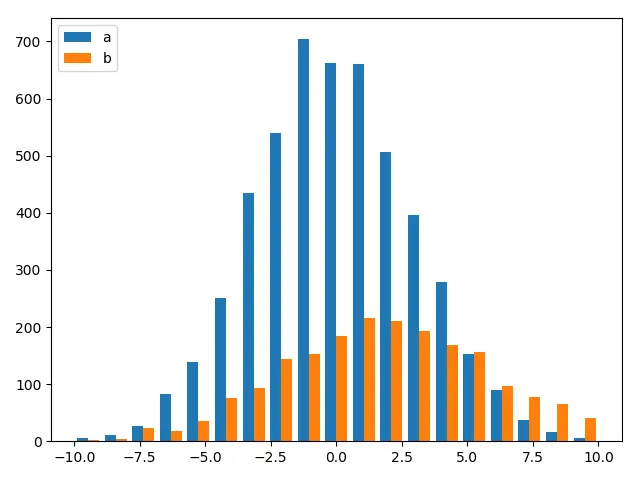
兩個直方圖,無重疊條
示例程式碼:
import numpy as np
import matplotlib.pyplot as plt

a = np.random.normal(0, 3, 3000)
b = np.random.normal(2, 4, 2000)

bins = np.linspace(-10, 10, 20)

plt.hist([a, b], bins, label=["a", "b"])
plt.legend(loc="upper left")
plt.show()
帶重疊條的兩個直方圖
示例程式碼:
import numpy as np
import matplotlib.pyplot as plt

a = np.random.normal(0, 3, 1000)
b = np.random.normal(2, 4, 900)

bins = np.linspace(-10, 10, 50)

plt.hist(a, bins, alpha=0.5, label="a")
plt.hist(b, bins, alpha=0.5, label="b")
plt.legend(loc="upper left")

plt.show()
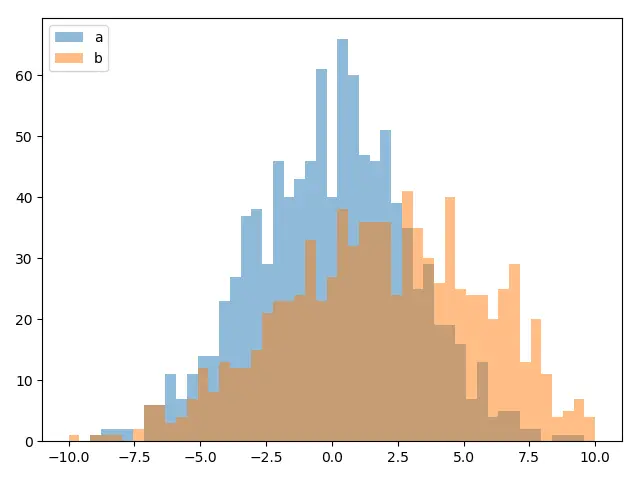
當我們兩次呼叫 plt.hist 分別繪製直方圖時,兩個直方圖將具有重疊的條,如你在上面看到的。
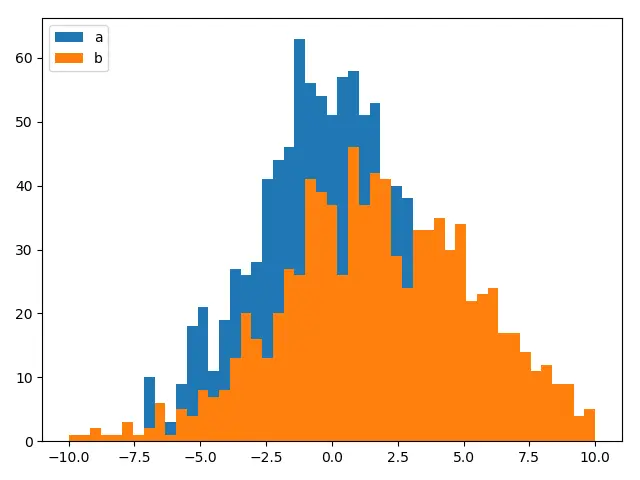
alpha 屬性指定繪圖的透明度。0.0 是完全透明的,而 1.0 是完全不透明的。
當兩個直方圖的 alpha 均設為 0.5 時,重疊區域將顯示組合顏色。但是,如果 alpha 為 0.0(預設值),重疊的條僅顯示兩個直方圖中較高值的顏色,而另一種顏色則被隱藏,如下所示。
作者: Jinku Hu

Founder of DelftStack.com. Jinku has worked in the robotics and automotive industries for over 8 years. He sharpened his coding skills when he needed to do the automatic testing, data collection from remote servers and report creation from the endurance test. He is from an electrical/electronics engineering background but has expanded his interest to embedded electronics, embedded programming and front-/back-end programming.
LinkedIn