Matplotlib 中如何繪製 x,y 座標列表
Jinku Hu
2020年6月25日

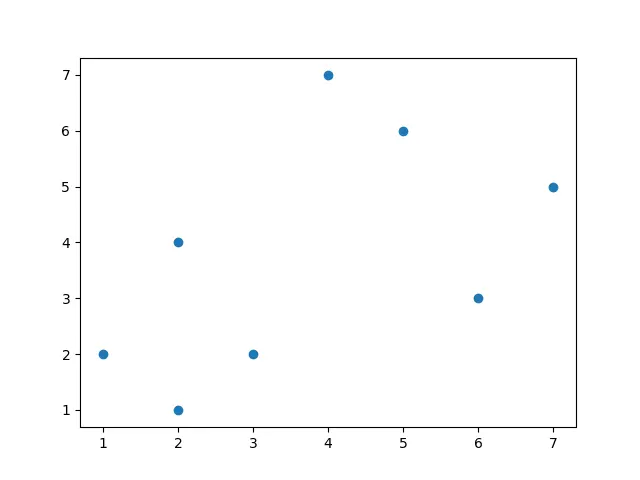
假設我們有一個類似 (x, y) 的二元組列表,我們需要將它們繪製為 (x, y) 座標。
data = [
    [1, 2],
    [3, 2],
    [4, 7],
    [2, 4],
    [2, 1],
    [5, 6],
    [6, 3],
    [7, 5],
]
在 Matplotlib 中繪製此 (x, y) 座標列表的完整程式碼如下,
import matplotlib.pyplot as plt

data = [
    [1, 2],
    [3, 2],
    [4, 7],
    [2, 4],
    [2, 1],
    [5, 6],
    [6, 3],
    [7, 5],
]

x, y = zip(*data)
plt.scatter(x, y)
plt.show()
x, y = zip(*data)
它使用 zip 函式將資料從成對的資料包解壓縮到列表。
plt.scatter(x, y)
我們需要建立散點圖,因此 scatter 是在此例中使用的正確的圖型型別。
作者: Jinku Hu

Founder of DelftStack.com. Jinku has worked in the robotics and automotive industries for over 8 years. He sharpened his coding skills when he needed to do the automatic testing, data collection from remote servers and report creation from the endurance test. He is from an electrical/electronics engineering background but has expanded his interest to embedded electronics, embedded programming and front-/back-end programming.
LinkedIn