Matplotlib 中如何建立不同大小的子圖 subplot

我們可以使用 gridspec_kw,gridspec 和 subplot2grid 指定不同比例的子圖來建立不同大小的子圖。
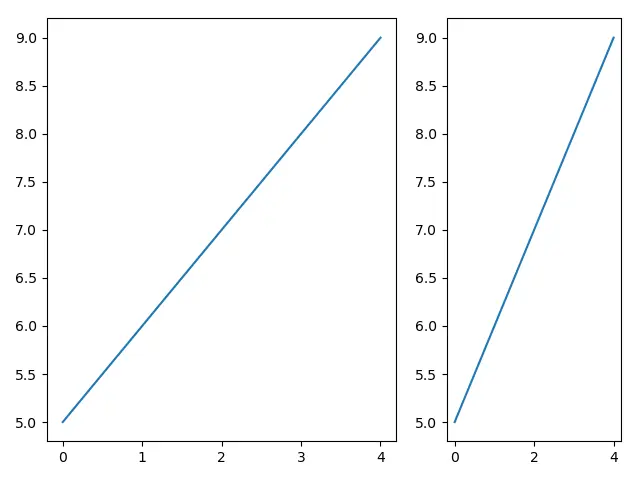
gridspec 方法
import matplotlib.pyplot as plt
from matplotlib import gridspec

fig = plt.figure()
spec = gridspec.GridSpec(ncols=2, nrows=1, width_ratios=[2, 1])

ax0 = fig.add_subplot(spec[0])
ax0.plot(range(5), range(5, 10))
ax1 = fig.add_subplot(spec[1])
ax1.plot(range(5), range(5, 10))

plt.show()
來自 gridspec 模組的 GridSpec 指定了子圖網格的幾何形狀。我們可以設定行數,列數和佈局引數,例如寬度和高度比。
spec = gridspec.GridSpec(ncols=2, nrows=1, width_ratios=[2, 1])
它指定圖形具有兩列和一行,並且寬度比為 2:1。
ax0 = fig.add_subplot(spec[0])
如上所述,ax0 物件在地物中的位置為 0,或者可以使用 spec[0, 0] 使它更清晰。
gridspec_kw 方法
import matplotlib.pyplot as plt

fig, ax = plt.subplots(
    2, 2, gridspec_kw={"width_ratios": [2, 1], "height_ratios": [1, 2]}
)

ax[0][0].plot(range(5), range(5, 10))
ax[0][1].plot(range(5), range(10, 5, -1))
ax[1][0].plot(range(5), range(5, 10))
ax[1][1].plot(range(5), range(10, 5, -1))

plt.show()
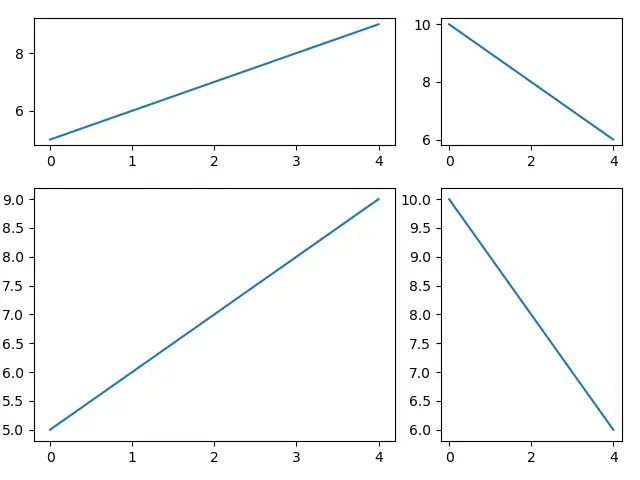
gridspec_kw 是具有 GridSpec 建構函式關鍵字的字典,用於指定子圖的網格。
寬度比指定為 2:1,高度比設定為 1:2。
subplot2grid 方法
subplot2grid 允許子圖在網格索引中佔用多個單元格。
def subplot2grid(shape,
                 loc,
                 rowspan=1,
                 colspan=1,
                 fig=None,
                 **kwargs):
shape 是網格的形狀,具有 2 個整數的序列,其第一個元素是行數,第二個元素是列數。
loc 是 axis 放置在網格中的位置。它也是 2 個整數的序列,其第一個元素是行號,第二個元素是列號。
rowspan 和 colspan 是 axis 向右(rowspan)或向底部(colspan)跨越的行數或列數。
工作程式碼示例:
import matplotlib.pyplot as plt

fig = plt.figure()

ax0 = plt.subplot2grid((1, 5), (0, 0), colspan=3)
ax1 = plt.subplot2grid((1, 5), (0, 3), colspan=2)

ax0.plot(range(5), range(5, 10))
ax1.plot(range(5), range(10, 5, -1))

plt.show()
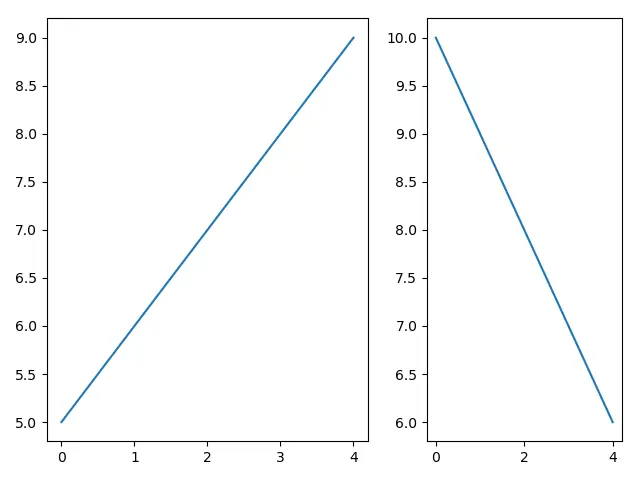
ax0 = plt.subplot2grid((1, 5), (0, 0), colspan=3)
ax1 = plt.subplot2grid((1, 5), (0, 3), colspan=2)
網格的形狀為 (1, 5),具有一行五列。
ax0 位於 (0, 0) 單元格中,佔據 3 列,而 ax1 位於 (0, 3) 中,並且佔據其他兩列。

Founder of DelftStack.com. Jinku has worked in the robotics and automotive industries for over 8 years. He sharpened his coding skills when he needed to do the automatic testing, data collection from remote servers and report creation from the endurance test. He is from an electrical/electronics engineering background but has expanded his interest to embedded electronics, embedded programming and front-/back-end programming.
LinkedIn