Matplotlib 中如何在影象上繪製矩形
當我們需要在 Matplotlib 中的影象或純圖形上繪製矩形時,應通過 add_patch 方法將 matplotlib.patches 中的 rectangle patch 新增到軸上。
matpotlib patch 是具有外觀和邊緣顏色的 2D artist。Matplotlib 具有如下的 patch,
ArcArrowArrowStyleBoxStyleCircleCirclePolygonConnectionPatchConnectionStyleEllipseFancyArrowFancyArrowPatchFancyBboxPatchPatchPathPathPatchPolygonRectangleRegularPolygonShadowWedge
Rectangle patch 繪製一個指定左下角座標和指定寬度和高度的矩形。
Rectangle(xy, width, height, angle=0.0, fill=True, **kwargs)
xy 是一個長度為 2 的元組,用於指定要繪製的矩形的左下角的座標,
width 是矩形的寬度
height 是矩形的高度,
angle 是逆時針角度,以度為單位。
fill 指定矩形是否用 facecolor 填充。
一些有效的 kwargs 如下,
edgecolor:矩形邊緣的顏色facecolor:矩形的填充色
在 Matplotlib 中繪製矩形
import matplotlib.pyplot as plt
import matplotlib.patches as patches

fig, ax = plt.subplots()

ax.plot([1, 4], [1, 4])

ax.add_patch(
    patches.Rectangle((1, 1), 0.5, 0.5, edgecolor="blue", facecolor="red", fill=True)
)

plt.show()
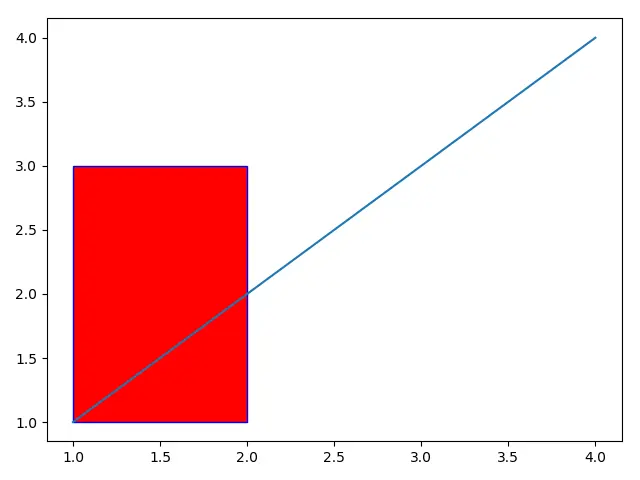
矩形 patch 由建構函式建立,
patches.Rectangle((1, 1), 1, 2, edgecolor="blue", facecolor="red", fill=True)
其左下角的座標為 (1, 1),其寬度為 1,高度為 2。
邊緣顏色指定為 blue,同時填充顏色為 red。
軸物件的 add_patch(P) 方法在軸上新增一個 Patch。
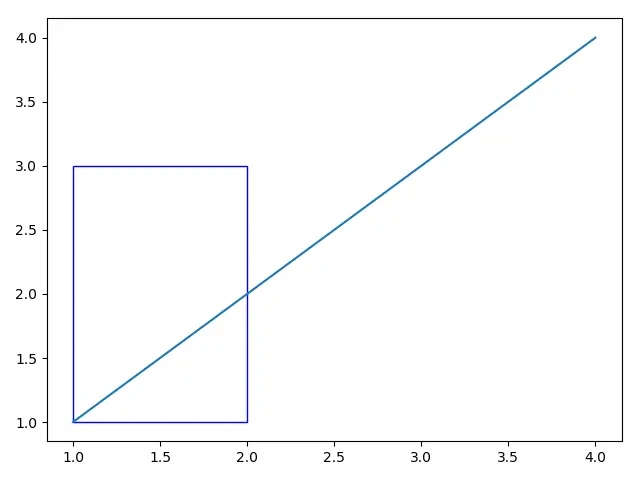
如果將 fill 設定為 False,即使 facecolor 已經指定了某些顏色了,矩形也不會被填充。
import matplotlib.pyplot as plt
import matplotlib.patches as patches

fig, ax = plt.subplots()

ax.plot([1, 4], [1, 4])

ax.add_patch(
    patches.Rectangle((1, 1), 1, 2, edgecolor="blue", facecolor="red", fill=False)
)

plt.show()
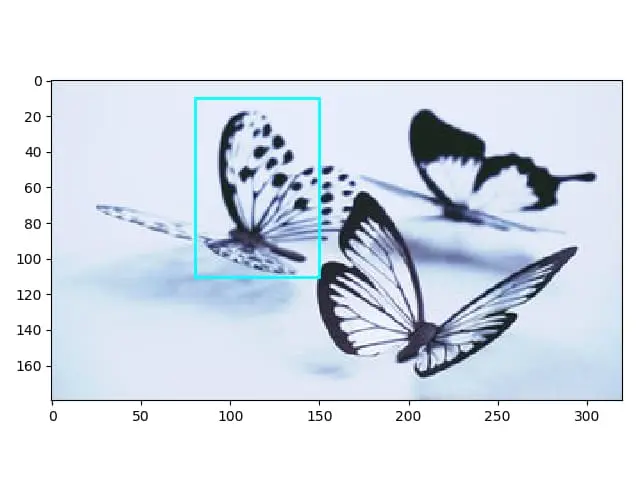
在 Matplotlib 中的影象上繪製矩形
如果我們需要在 Matplotlib 中的影象上繪製一個矩形,則它與上述方法類似,但是需要額外的步驟來獲取軸 Axes 控制代碼。
import matplotlib.pyplot as plt
import matplotlib.patches as patches
from PIL import Image

im = Image.open("butterfly.jpg")

plt.imshow(im)

ax = plt.gca()

rect = patches.Rectangle((80, 10), 70, 100, linewidth=2, edgecolor="cyan", fill=False)

ax.add_patch(rect)

plt.show()
plt.imshow(im) 顯示影象 butterfly.jpg,而軸 Axes 的控制代碼可以通過函式 plt.gca() 獲得,gca 是獲取當前軸 get current axes 的首字母縮寫。

Founder of DelftStack.com. Jinku has worked in the robotics and automotive industries for over 8 years. He sharpened his coding skills when he needed to do the automatic testing, data collection from remote servers and report creation from the endurance test. He is from an electrical/electronics engineering background but has expanded his interest to embedded electronics, embedded programming and front-/back-end programming.
LinkedIn