如何在 Matplotlib 中建立曲面圖
Suraj Joshi
2020年6月25日

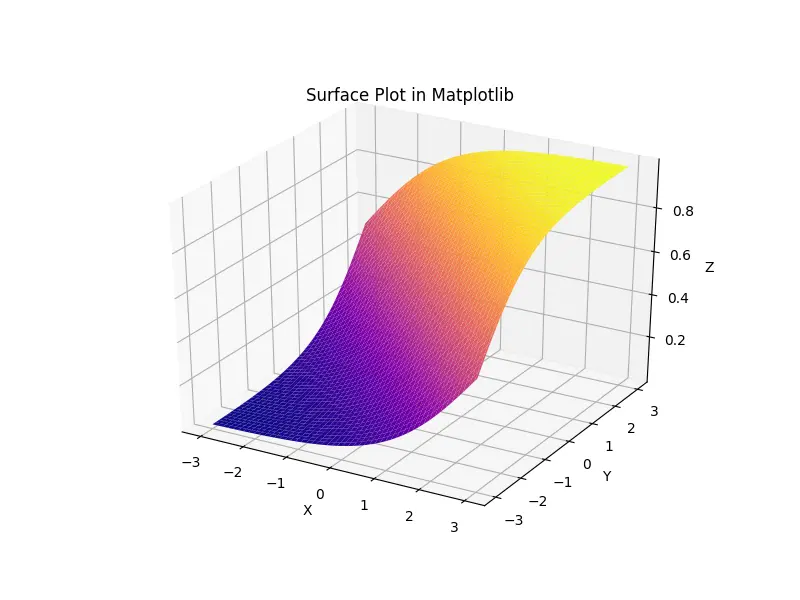
在 Matplotlib 中,我們使用 mplot3d 工具包進行 3-D 分析和視覺化,其中包含基於 Matplotlib 的 2-D 函式構建的 3-D 繪圖方法。我們可以通過將 projection='3d'引數傳遞給 Matplotlib 中任何軸的建立函式來建立 3-D 軸。初始化 3-D 軸後,我們可以使用 plot_surface() 方法生成曲面圖。
Axes3D.plot_surface() 方法
我們可以使用 Axes3D.plot_surface(X, Y, Z, *args, **kwargs) 方法建立表面圖其中 X,Y 和 Z 均為二維陣列。
import numpy as np
import matplotlib.pyplot as plt
from mpl_toolkits import mplot3d

fig = plt.figure(figsize=(8, 6))
ax3d = plt.axes(projection="3d")

xdata = np.linspace(-3, 3, 100)
ydata = np.linspace(-3, 3, 100)
X, Y = np.meshgrid(xdata, ydata)
Z = 1 / (1 + np.exp(-X - Y))

ax3d = plt.axes(projection="3d")
ax3d.plot_surface(X, Y, Z, cmap="plasma")
ax3d.set_title("Surface Plot in Matplotlib")
ax3d.set_xlabel("X")
ax3d.set_ylabel("Y")
ax3d.set_zlabel("Z")

plt.show()

這樣,Matplotlib 會在 3D 空間中生成曲面圖。這裡的 cmap 引數用於在 3D 色彩空間中很好地表示我們的資料。圖的顏色隨因變數值的變化而變化。
我們可以根據以下引數自定義圖:
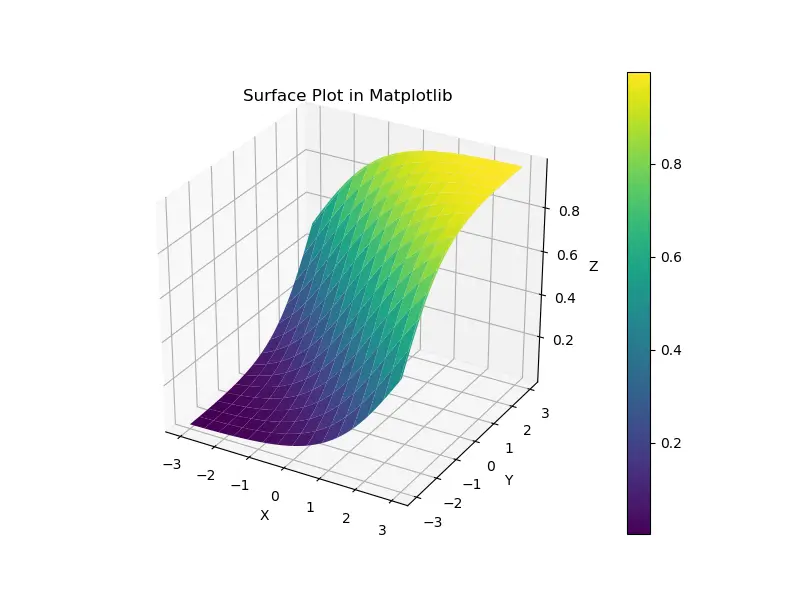
rstride:行步長,預設值為 10cstride:列步長,預設值為 10color:表面的顏色cmap:表面的顏色圖facecolors:表面中每個補丁的面部顏色norm:Normalize 的一個例項,用於將值對映到顏色vmin:要對映的最小值vmax:要對映的最大值shade:是否遮罩臉部顏色
import numpy as np
import matplotlib.pyplot as plt
from mpl_toolkits import mplot3d

fig = plt.figure(figsize=(8, 6))
ax3d = plt.axes(projection="3d")

xdata = np.linspace(-3, 3, 100)
ydata = np.linspace(-3, 3, 100)
X, Y = np.meshgrid(xdata, ydata)
Z = 1 / (1 + np.exp(-X - Y))

ax3d = plt.axes(projection="3d")
surf = ax3d.plot_surface(X, Y, Z, rstride=7, cstride=7, cmap="viridis")
fig.colorbar(surf, ax=ax3d)
ax3d.set_title("Surface Plot in Matplotlib")
ax3d.set_xlabel("X")
ax3d.set_ylabel("Y")
ax3d.set_zlabel("Z")

plt.savefig("Customized Surface Plot.png")

plt.show()

在這個例子中,我們通過使用 colorbar() 方法在圖形中新增一個顏色條,並將表面繪圖物件傳遞給該方法,這使圖形更具資訊性。
作者: Suraj Joshi
Suraj Joshi is a backend software engineer at Matrice.ai.
LinkedIn