如何在 Matplotlib 中用線連線散點圖點
Suraj Joshi
2023年1月30日

我們可以在呼叫了 scatter()和 plot()之後,通過呼叫 show()來連線直線的散點,並使用 line 和 point 屬性呼叫 plot(),然後使用關鍵字 zorder 來指定繪圖順序。
在呼叫 scatter()和 plot()之後呼叫 show()
matplotlib.pyplot.scatter(x, y),其中 x 是 x 座標序列,而 y 是 y 座標序列會建立點的散點圖。要按順序連線這些散點圖的點,請呼叫 matplotlib.pyplot.plot(x, y),使 x 和 y 與傳遞給 scatter() 函式的點相同。
import numpy as np
import matplotlib.pyplot as plt

x = np.linspace(0, 5, 50)
y = np.sin(2 * np.pi * x)

plt.scatter(x, y)
plt.plot(x, y)
plt.title("Connected Scatterplot points with line")
plt.xlabel("x")
plt.ylabel("sinx")
plt.show()
figure.tight_layout()
輸出:
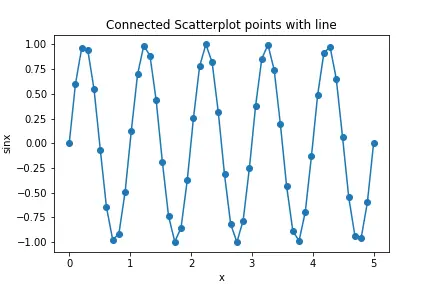
具有線型屬性的 matplotlib.pyplot.plot() 函式
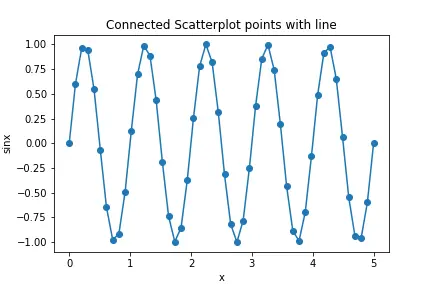
我們也可以通過僅呼叫 matplotlib.pyplot.plot() 函式以及 linestyle 屬性來將 scatterplot 點與直線連線起來。
import numpy as np
import matplotlib.pyplot as plt

x = np.linspace(0, 5, 50)
y = np.sin(2 * np.pi * x)

plt.plot(x, y, linestyle="solid", color="blue")
plt.title("Connected Scatterplot points with line")
plt.xlabel("x")
plt.ylabel("sinx")
plt.show()
figure.tight_layout()
輸出:
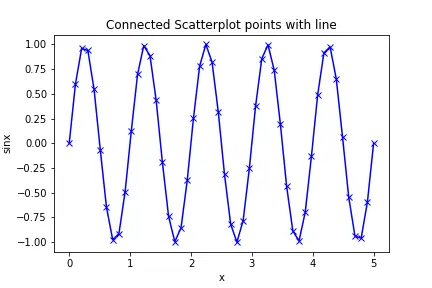
同樣,我們也可以嘗試其他不同的 linestyles。
import numpy as np
import matplotlib.pyplot as plt

x = np.linspace(0, 5, 50)
y = np.sin(2 * np.pi * x)

plt.plot(x, y, "xb-")
plt.title("Connected Scatterplot points with line")
plt.xlabel("x")
plt.ylabel("sinx")
plt.show()
輸出:
關鍵字 zorder 更改 Matplotlib 繪圖順序
我們可以使用關鍵字 zorder 來設定 Matplotlib 圖中的繪製順序。我們將為 plot 和 scatter 分配不同的順序,然後顛倒順序以顯示不同的繪製順序行為。
import numpy as np
import matplotlib.pyplot as plt

x = np.linspace(0, 5, 50)
y = np.sin(2 * np.pi * x)

plt.scatter(x, y, color="r", zorder=1)
plt.plot(x, y, color="b", zorder=2)

plt.title("Connected Scatterplot points with line")
plt.xlabel("x")
plt.ylabel("sinx")

plt.show()
輸出:
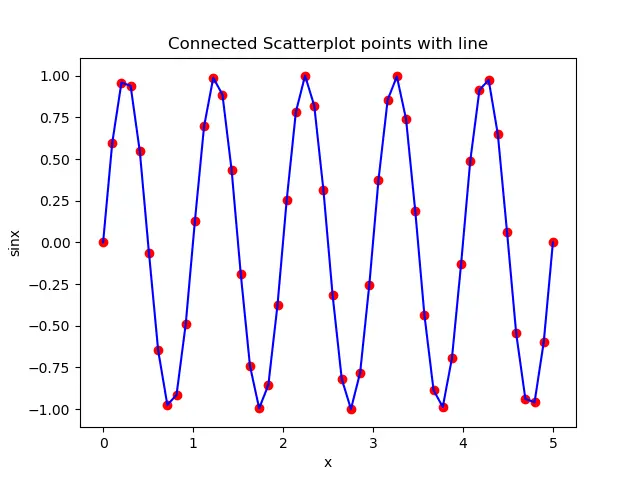
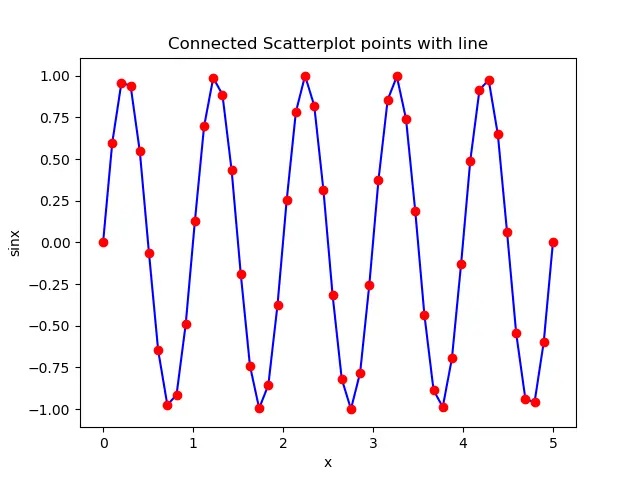
plot()的順序為 2,大於 scatter()的順序,因此,散點圖位於線圖的頂部。
如果我們顛倒順序,則線圖將位於散點圖的頂部。
import numpy as np
import matplotlib.pyplot as plt

x = np.linspace(0, 5, 50)
y = np.sin(2 * np.pi * x)

plt.scatter(x, y, color="r", zorder=2)
plt.plot(x, y, color="b", zorder=1)

plt.title("Connected Scatterplot points with line")
plt.xlabel("x")
plt.ylabel("sinx")

plt.show()
輸出:
作者: Suraj Joshi
Suraj Joshi is a backend software engineer at Matrice.ai.
LinkedIn