Matplotlib 中如何設定繪圖背景顏色
Jinku Hu
2023年1月30日
軸 axes 物件的 set_facecolor(color) 方法設定背景顏色,或者換句話說,設定相應 plot 的外觀顏色。
設定特定圖的背景色
在呼叫 set_facecolor() 方法之前,我們需要獲取 axes 物件。
1. 類似於 Matlab 的 API
plt.plot(x, y)
ax = plt.gca()
完整的示例程式碼:
import matplotlib.pyplot as plt
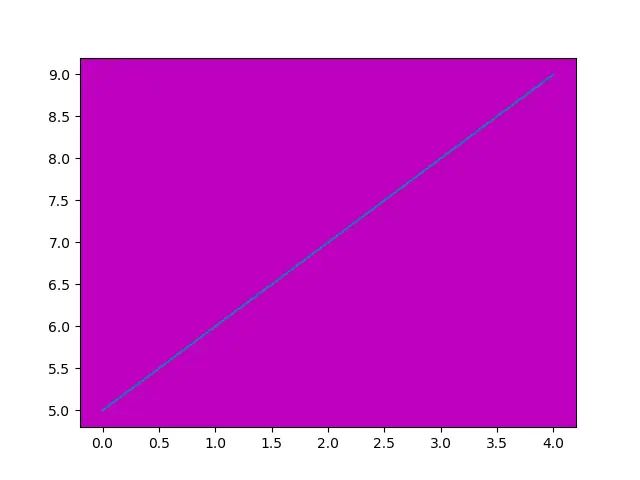
plt.plot(range(5), range(5, 10))
ax = plt.gca()
ax.set_facecolor("m")
plt.show()
2. 以物件導向的方法建立圖形和軸
可以一起建立圖和軸物件,
fig, ax = plt.subplots()
或者先建立 figure,然後再初始化 axes。
fig = plt.figure()
ax = fig.add_subplot(1, 1, 1)
完整的示例程式碼:
import matplotlib.pyplot as plt

fig, ax = plt.subplots(1)

ax.plot(range(5), range(5, 10))

ax.set_facecolor("m")
plt.show()
或者,
import matplotlib.pyplot as plt

fig = plt.figure()
ax = fig.add_subplot(1, 1, 1)

ax.plot(range(5), range(5, 10))

ax.set_facecolor("m")
plt.show()
Matplotlib 設定多個繪圖的預設圖背景色
如果我們需要為多個繪圖設定預設背景色,可以在 rcParams 物件中設定 axes.facecolor 屬性。
plt.rcParams["axes.facecolor"] = color
完整的示例程式碼:
import matplotlib.pyplot as plt

plt.rcParams["axes.facecolor"] = "m"

plt.subplot(1, 2, 1)
plt.plot(range(5), range(5, 10))

plt.subplot(1, 2, 2)
plt.plot(range(5), range(10, 5, -1))

plt.show()
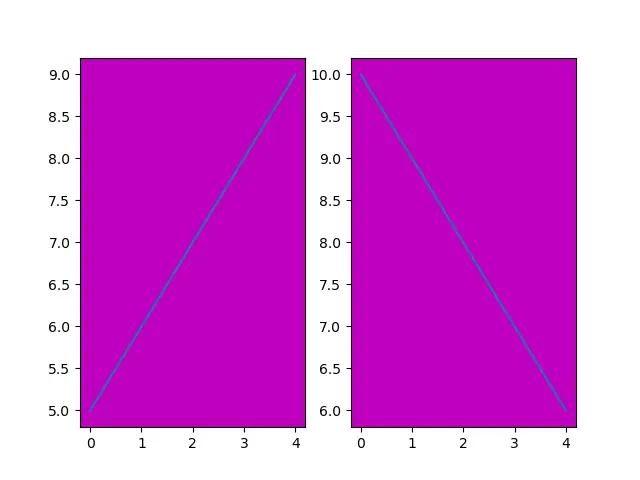
如你所見,兩個圖的背景色是相同的。
作者: Jinku Hu

Founder of DelftStack.com. Jinku has worked in the robotics and automotive industries for over 8 years. He sharpened his coding skills when he needed to do the automatic testing, data collection from remote servers and report creation from the endurance test. He is from an electrical/electronics engineering background but has expanded his interest to embedded electronics, embedded programming and front-/back-end programming.
LinkedIn