Matplotlib 中如何更改圖例字型大小
我們有不同的方法來設定 Matplotlib 中圖例中文字的字型大小。
rcParams 方法指定字型大小
rcParams 是處理 Matplotlib 屬性和預設樣式的字典。
1. plt.rc('legend', fontsize= ) 方法
fontsize 可以是單位為 points 的整數,也可以是表徵大小的字串,例如
xx - -small
x - small
small
medium
large
x - large
xx - large
plt.rc("legend", fontsize=16)
plt.rc("legend", fontsize="medium")
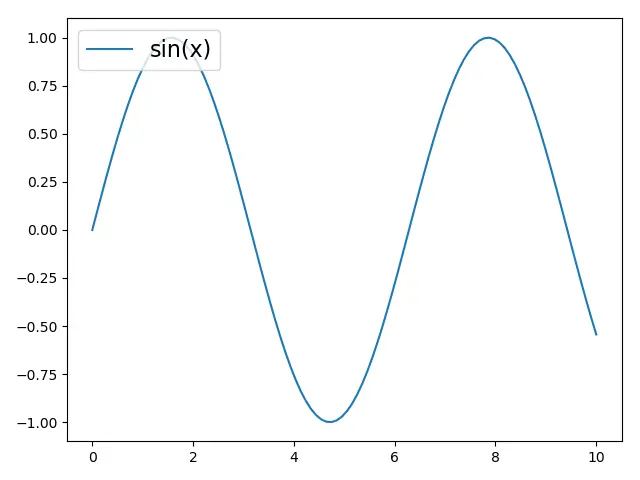
2. plt.rcparams.update() 方法
import matplotlib.pyplot as plt
import numpy as np

x = np.linspace(0, 10, 100)

plt.plot(x, np.sin(x), label="sin(x)")

params = {"legend.fontsize": 16, "legend.handlelength": 3}

plt.rcParams.update(params)

plt.legend(loc="upper left")

plt.tight_layout()

plt.show()
legend.fontsize 指定圖例字型大小,而 legend.handlelength 指定圖例控制代碼長度,以字型大小為單位。
plt.rcParams.update(params) 用上面定義的字典 params 來更新 Matplotlib 屬性和樣式。
或者,你可以通過將鍵值放在括號 [] 中來更新 rcParams 字典,
plt.rcParams["legend.fontsize"] = 16
plt.rcParams["legend.handlelength"] = 16
plt.legend(fontsize= ) 指定圖例字型大小的方法
plt.legend(fontsize=) 可以在建立每個圖例時指定圖例字型大小。
import matplotlib.pyplot as plt
import numpy as np

x = np.linspace(0, 10, 100)

plt.plot(x, np.sin(x), label="sin(x)")

plt.legend(fontsize=16, loc="upper right")

plt.show()
圖例中的 prop 屬性
圖例中的 prop 屬性可以設定圖例的單個字型大小。prop 是來自 matplotlib.font_manager.FontProperties 中的關鍵字構成的字典。
plt.legend(prop={"size": 16})
例:
import matplotlib.pyplot as plt
import numpy as np

x = np.linspace(0, 10, 100)

plt.plot(x, np.sin(x), label="sin(x)")

plt.legend(prop={"size": 16}, loc="best")

plt.show()

Founder of DelftStack.com. Jinku has worked in the robotics and automotive industries for over 8 years. He sharpened his coding skills when he needed to do the automatic testing, data collection from remote servers and report creation from the endurance test. He is from an electrical/electronics engineering background but has expanded his interest to embedded electronics, embedded programming and front-/back-end programming.
LinkedIn