在 Matplotlib 中顯示顏色條
Manav Narula
2021年7月4日

在本教程中,我們將討論如何在 Python 中的 matplotlib 圖形中顯示顏色條。
要建立顏色條,我們必須使用 matplotlib.pyplot.colorbar() 函式。
下面的程式碼顯示了一個簡單的例子。
import random
import matplotlib.pyplot as plt

s_x = random.sample(range(0, 100), 20)
s_y = random.sample(range(0, 100), 20)

s = plt.scatter(s_x, s_y, c=s_x, cmap="viridis")

c = plt.colorbar()
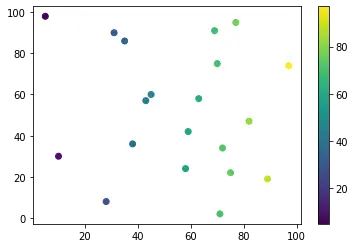
在上面的示例中,我們建立了一個放置在繪圖之外的簡單顏色條。我們使用 cmap 引數指定了顏色圖。
我們還可以指定我們希望顯示顏色條的軸。如果我們願意,我們可以將它新增到繪圖的軸上。
例如,
import random
import matplotlib.pyplot as plt

s_x = random.sample(range(0, 100), 20)
s_y = random.sample(range(0, 100), 20)

fig, ax = plt.subplots()
cax = fig.add_axes([0.27, 0.8, 0.5, 0.05])

im = ax.scatter(s_x, s_y, c=s_x, cmap="viridis")
fig.colorbar(im, cax=cax, orientation="horizontal")
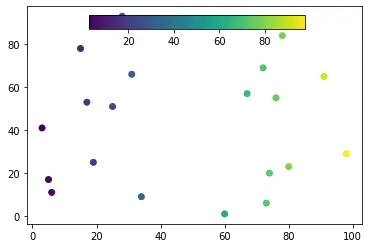
在上面的示例中,我們使用 subplots() 函式來獲取圖形和軸物件,並使用它來建立顏色條的軸。我們使用 colorbar() 函式中的 cax 引數指定了這一點。
另外,請注意 orientation 引數的使用,它改變了最終顏色條的方向。除此之外,我們可以使用不同的引數來控制顏色條的形狀和大小。例如,shrink 可以將顏色條的大小縮小一小部分,aspect,這是條邊的比例,還有更多。
作者: Manav Narula

Manav is a IT Professional who has a lot of experience as a core developer in many live projects. He is an avid learner who enjoys learning new things and sharing his findings whenever possible.
LinkedIn