在 Matlab 中在影象上畫線
Ammar Ali
2024年2月15日

本教程將討論如何使用 MATLAB 中的 plot() 和 insertshape() 函式在影象上繪製線條和其他形狀。
在 MATLAB 中使用 plot() 函式在影象上畫線
如果你想在影象上繪製一條線或其他變數,例如正弦波,你可以使用 plot() 函式來執行此操作。例如,讓我們在影象上畫一條線。請參考下面的程式碼。
load clown
image(X)
hold on
plot([180 50], [60 250],'Color','r','LineWidth',5)
輸出:
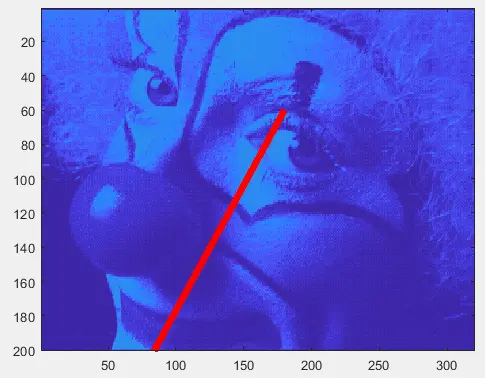
在上面的程式碼中,我們使用了一個已經儲存的小丑影象,並使用 hold on 命令在小丑影象上繪製了一條線。你可以使用 Color 屬性更改線條的顏色,使用 LineWidth 屬性更改線條寬度。你還可以更改線條的起點和終點。
在 MATLAB 中使用 insertshape() 函式在影象上畫線
如果你想在影象上繪製形狀:線、圓、矩形和多邊形,你可以使用 insertshape() 函式來執行此操作。insertshape() 函式的基本語法如下所示。
Output = insertShape(Image, shape, shape_position)
在上面的程式碼中,Image 是要在其上繪製的影象物件,shape 是要在影象上繪製的形狀,shape_position 是要在影象上繪製形狀的位置。例如,讓我們在影象上畫一個圓圈。請參考下面的程式碼。
X = imread('peppers.png');
output = insertShape(X,'circle',[100 100 100],'LineWidth',5);
imshow(output)
輸出:

在上面的程式碼中,我們使用了一個已經儲存的辣椒影象,並使用 insertshape() 函式在影象上繪製了一個圓圈。在圓的情況下,位置由三個值組成;第一個值是 x 軸位置,第二個值是 y 軸位置,第三個值是圓的半徑。在矩形的情況下,位置由四個值組成,第一個值是 x 軸位置,第二個值是 y 軸位置,第三個值是寬度,第四個值是高度長方形。你還可以使用 Color 屬性更改形狀的顏色,使用 LineWidth 屬性更改線寬,以及使用 Opacity 屬性在填充形狀的情況下更改不透明度。檢視此連結以獲取有關 insertshape() 函式的更多詳細資訊。
作者: Ammar Ali
